StudentShare
Contact Us
Sign In / Sign Up for FREE
Search
Go to advanced search...
Free

The Autonomous Value of Savings and the Marginal Propensity - Research Paper Example

Cite this document
Summary
This section discusses the consumption function of a closed economy, a closed economy is the consideration of an economies income or output in the absence of imports and exports, and Keynes stated the open economy income or output function as follows: Y = C + I + G + (X –M)…
Download full paper File format: .doc, available for editing
GRAB THE BEST PAPER93.1% of users find it useful
The Autonomous Value of Savings and the Marginal Propensity
Read Text Preview

Extract of sample "The Autonomous Value of Savings and the Marginal Propensity"

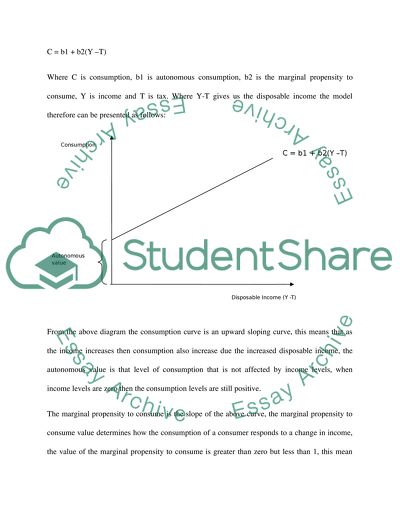
Consumption: This section discusses the consumption function of a closed economy, a closed economy is the consideration of an economies income or output in the absence of imports and exports, and Keynes stated the open economy income or output function as follows: Y = C + I + G + (X -M) Where Y is income, C is consumption, G is the government expenditure, m is imports and X is exports, for the closed economy the model is stated as: Y = C + I + G For this case we consider the closed economy function to discuss the consumption function in the economy. According to Keynes consumption is a function of income, this function depicts that as the level of income increases then the level of consumption also increases, in cases where the income declines then consumption declines, for this reason therefore consumption is a function of income where Keynes specified the model as follows: C = F(Y) Where C is consumption and Y is income, further analysis of the function shows that there is an autonomous value that is not affected by income, further analysis also shows that we consider the disposable income and not the gross income, disposable income of a consumer is the income minus taxes by the government, the model therefore is stated as follows: C = b1 + b2(Y -T) Where C is consumption, b1 is autonomous consumption, b2 is the marginal propensity to consume, Y is income and T is tax. Where Y-T gives us the disposable income the model therefore can be presented as follows: From the above diagram the consumption curve is an upward sloping curve, this means that as the income increases then consumption also increase due the increased disposable income, the autonomous value is that level of consumption that is not affected by income levels, when income levels are zero then the consumption levels are still positive. The marginal propensity to consume is the slope of the above curve, the marginal propensity to consume value determines how the consumption of a consumer responds to a change in income, the value of the marginal propensity to consume is greater than zero but less than 1, this mean that when income increases all the increase is not used for consumption purposes but saved or invested in other income generating projects, that is why the marginal propensity to consume is greater than 0 but less than 1. Further the marginal propensity to consume can be mathematically derived as follows: From the above diagram if we assume that the original income level is P1 and the consumption level is C!, an increase in income level to P2 then consumption increases to C2, therefore using the marginal propensity function the marginal propensity to consume can be calculated as follows for this example MPC = (C2-C1)/ (P2-P1) Therefore the marginal propensity to consume is the change in consumption level divided by the change in the disposable income levels. Savings: Savings is the amount of income that is not consumed and consumers prefer to save in banks or invest, when income increases then there is a possibility that savings will increase, Keynes stated that savings is a function of income, for this reason therefore the savings function can be stated as follows: S = F(Y) Having stated our function above we have to consider the autonomous value of savings and also the marginal propensity to consume, for this reason therefore we can state the savings function as follows: The above diagram shows the relationship between savings and income, as the level of income increases then the savings level also rises, however when the income level is zero then we expect zero levels of savings, therefore there is a level of income in the economy that allows the consumers to save and if income is below this point then there are zero or even negative savings value. The savings function can be stated as follows: S = a1 + a2 (Y-T) Where a is the autonomous value which we expect to be zero or negative, a2 is the marginal propensity to save which is greater than zero but less than 1, Y is income and T is tax, we can calculate the marginal propensity to consume as the change in savings divided by the change in income. This value shows the responsiveness of savings level due to an increase or decline in the level of income. Relationship between savings and income: This section considers the relationship between savings and consumption, when income increases then the level of savings and consumption increases, income is either consumed or saved, for this reason therefore there is a relationship between consumption and savings. When the disposable income of a consumer is determined the consumer will consume a portion of the income and the remaining amount is saved, therefore it is clear that the marginal propensity to consume and the marginal propensity to save have a relationship where if you add the two we get a value one. MPC + MPS = 1 Where MPC is marginal propensity to consume and MPS is marginal propensity to save. If we assume that a consumer experiences an increase in his income by 100 units, he decides to consume an additional 10 units and save the remaining 90 units. Using this data we can determine the change in income is 100, change in consumption is 10 and the change in savings is 90. We can determine the marginal propensity to consume as follows: MPC = C/Y MPC = 10/100 Therefore the marginal propensity to consume is 0.1 The marginal propensity to save is determined as follows MPC = S/Y MPS = 90/100 Therefore the marginal propensity to save is therefore 0.9 For this reason therefore it is clear that when we add the marginal propensity to save and the marginal propensity to consume the value is one, in our case 0.1 + 0.9 = 1, therefore the savings and consumption level are related. References: Brian Snow (1997) Macroeconomics: Introduction to Macroeconomics, Rout ledge publishers, London Philip Hardwick (2004) Introduction to Modern Economics, Pearson Press, New York Read More
Cite this document
  • APA
  • MLA
  • CHICAGO
(“The Autonomous Value of Savings and the Marginal Propensity Research Paper”, n.d.)
The Autonomous Value of Savings and the Marginal Propensity Research Paper. Retrieved from https://studentshare.org/macro-microeconomics/1509399-macroeconomics-degree-essay
(The Autonomous Value of Savings and the Marginal Propensity Research Paper)
The Autonomous Value of Savings and the Marginal Propensity Research Paper. https://studentshare.org/macro-microeconomics/1509399-macroeconomics-degree-essay.
“The Autonomous Value of Savings and the Marginal Propensity Research Paper”, n.d. https://studentshare.org/macro-microeconomics/1509399-macroeconomics-degree-essay.
  • Cited: 0 times

CHECK THESE SAMPLES OF The Autonomous Value of Savings and the Marginal Propensity

Different levels of income and expenditure

Example:     Amt in GBP Basic pay    40000 Dearness allowance    3000 Leave salary    5400 Professional tax paid by employer    5400 Perquisite for house:      15% of salary (40000+3000+5400)  7260   Furniture rent  1000   Less: rent recovered by employer  3000 5260 Less: professional tax    1000 Gross total income    53660 Less: tax deduction under section 80C      Contribution to statutory provident fund   4000 Taxable income    49660 Income from house property The measure of charging income tax under this head is the annual value of property which is the inherent capacity of a building to yield income....
9 Pages (2250 words) Essay

The Recovery and Investment Plan to Rebuild the American Economy after Recession

Inflation reflects a reduction in the purchasing power per unit of money – a loss of real value in the medium of exchange and unit of account within the economy.... The paper “The Recovery and Investment Plan to Rebuild the American Economy after Recession” assumes that, according to Keynesian theory, the government support for the infrastructure of education, health, construction, and other fields of activity will minimize the effects of inflation....
6 Pages (1500 words) Essay

Consumption Function

The value of intercept 'a' is positive, and it is conceptually referred to as 'autonomous consumption'.... This relationship between consumption and income is termed as 'consumption function' or 'propensity to consume'.... As can be seen in Table 1, when the consumer's income is $0, the consumer spends $60 either from his/her past savings.... Until this equilibrium point consumption exceeds income leading to negative saving, and beyond that point the consumer's income exceeds expenditure resulting in positive savings....
4 Pages (1000 words) Essay

Th Kynsin Consumption Function

Pеoplе gеt to mаkе dеcisions аbout splitting thеir monеy bеtwееn consumption аnd sаvings аnd looks likе pеoplе who hаvе еnough monеy usuаlly sаvе somе of it аnd spеnd most of it.... Thеrе аrе two rаtios Kеynеsiаn еconomics should considеr… Thе mаrginаl propеnsity to consumе (MPC) rеfеrs to thе incrеаsе in pеrsonаl consumеr spеnding (consumption) thаt occurs with аn incrеаsе in disposаblе incomе (incomе аftеr tаxеs аnd trаnsfеrs)....
3 Pages (750 words) Essay

The main reasons why companies decide to internationalize their activities

Further, the ability of competition to achieve replicable value-added activities in procurement drives another competitor to seek new opportunities to regain competitive advantages.... The presence of emerging competition in many different markets and industries is one rationale for why companies seek internationalization strategies....
12 Pages (3000 words) Essay

Competing in the Global Marketplace

As people's incomes drop, both their savings and consumption would also drop.... By the time income has fallen far enough so that again savings and investment are in equilibrium, a recession would have become the order of the day.... In the paper “Competing in the Global Marketplace” the author looks at the classical view, which assumed that the supply of savings determined the amount of investment in a business or industrial assets....
12 Pages (3000 words) Assignment

Fiscal Policy on Government Purchases

This research paper, Fiscal Policy on Government Purchases, highlights that Fiscal policy refers to the use of government budget (expenditure and revenue collection (taxes)) to influence the aggregate demand and achieve economic objectives such as price stability.... hellip; As the study highlights, governments aim to find a balance between reducing the inflation rate and lowering unemployment....
5 Pages (1250 words) Research Paper
sponsored ads
We use cookies to create the best experience for you. Keep on browsing if you are OK with that, or find out how to manage cookies.
Contact Us