StudentShare
Contact Us
Sign In / Sign Up for FREE
Search
Go to advanced search...
Free

The Production Function for Buses - Edgeworth Box - Assignment Example

Cite this document
Summary
The paper "The Production Function for Buses - Edgeworth Box" states that any deviation from the curve will be less effective for the company because with such indicators all the resources are allocated fully and efficaciously providing maximum production of two products…
Download full paper File format: .doc, available for editing
GRAB THE BEST PAPER91.7% of users find it useful
The Production Function for Buses - Edgeworth Box
Read Text Preview

Extract of sample "The Production Function for Buses - Edgeworth Box"

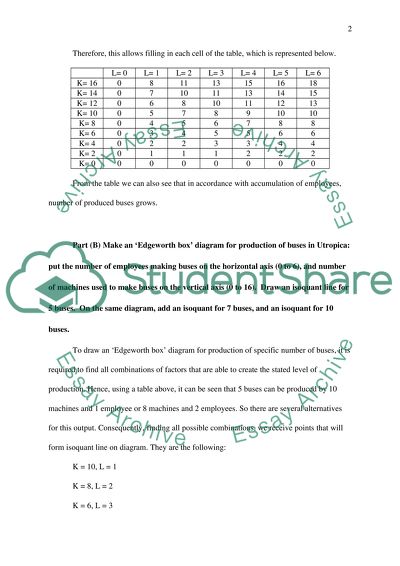
? Microeconomics Part (A) Does the production function for buses imply increasing or diminishing returns to scale? (explain how we can tell). Find the number of buses, in each cell of this table. Production function shows maximum output with every given combination of production factors (Dwivedi, 2006, p. 211). The number of buses in Utropica is represented by Cobb-Douglas function, which is considered to be linear and homogenous demonstration of constant return by changing of production scale. According to the fact that a sum of indicators’ powers defines type of a function concerning its increase or decrease, we can predict functional behavior beforehand by making the following calculation: F(L, K) = 1.1 + 0.41 = 1.51 Taking into account that calculated figure exceeds 1, it can be concluded that our function will reproduce increasing returns to scale. This means that with an accumulation of production factors volume of produced goods will grow. To find number of buses with every combination of production factors, it is necessary to substitute each number of employees and quantity of machines for K and L indicators. Hence, if number of machines is 14 and number of employees who make buses is 5, then calculation of production output will be the following: In accordance with above example, we can calculate all the rest level of production. (K=10, L=3): (K=8, L=1): etc. Therefore, this allows filling in each cell of the table, which is represented below.   L= 0 L= 1 L= 2 L= 3 L= 4 L= 5 L= 6 K= 16 0 8 11 13 15 16 18 K= 14 0 7 10 11 13 14 15 K= 12 0 6 8 10 11 12 13 K= 10 0 5 7 8 9 10 10 K= 8 0 4 5 6 7 8 8 K= 6 0 3 4 5 5 6 6 K= 4 0 2 2 3 3 4 4 K= 2 0 1 1 1 2 2 2 K= 0 0 0 0 0 0 0 0 From the table we can also see that in accordance with accumulation of employees, number of produced buses grows. Part (B) Make an ‘Edgeworth box’ diagram for production of buses in Utropica: put the number of employees making buses on the horizontal axis (0 to 6), and number of machines used to make buses on the vertical axis (0 to 16). Draw an isoquant line for 5 buses. On the same diagram, add an isoquant for 7 buses, and an isoquant for 10 buses. To draw an ‘Edgeworth box’ diagram for production of specific number of buses, it is required to find all combinations of factors that are able to create the stated level of production. Hence, using a table above, it can be seen that 5 buses can be produced by 10 machines and 1 employee or 8 machines and 2 employees. So there are several alternatives for this output. Consequently, finding all possible combinations, we receive points that will form isoquant line on diagram. They are the following: K = 10, L = 1 K = 8, L = 2 K = 6, L = 3 K = 6, L = 4 Using the same method, we find combinations of the factors for producing 7 buses. K = 14, L = 1 K = 10, L = 2 K = 8, L = 4 And finally, 10 buses can be produced with a help of the following combinations: K = 14, L = 2 K = 12, L = 3 K = 10, L = 5 K = 10, L = 6 Having number of employees on the horizontal axis and number of machines on the vertical axis, diagram for three levels of production is represented below. Represented diagram proves the fact that isoquants never intersect with each other and have negative angulation. Also it can be noticed that isoquant with the biggest production is situated more to the right and upper compared to the rest (Slavin, 2011, p. 289). Part (C) If an employee doesn’t work on buses, s/he works on cars; machines not used for buses are used for cars. The production function for cars is Ncars = 0.34 K0.83L0.96 In the same ‘Edgeworth box’ as Part (B), add an isoquant for 9 cars. Add an isoquant to represent 6 cars, and a third isoquant for 3 cars, on the same diagram. Explain how this ‘Edgeworth Box’ can be used to show inefficient combinations of people & machines. Taking into account that the production function for cars is , we will use the same procedure for car production as for buses to define required combinations of factors and draw isoquant lines. So the table is represented below.   L= 0 L= 1 L= 2 L= 3 L= 4 L= 5 L= 6 K= 16 0 3 7 10 13 16 19 K= 14 0 3 6 9 12 14 17 K= 12 0 3 5 8 10 13 15 K= 10 0 2 4 7 9 11 13 K= 8 0 2 4 5 7 9 11 K= 6 0 2 3 4 6 7 8 K= 4 0 1 2 3 4 5 6 K= 2 0 1 1 2 2 3 3 K= 0 0 0 0 0 0 0 0 Consequently, on diagram points for various productions of cars will be the following: For 9 cars: K = 14, L = 3 K = 10, L = 4 K = 8, L = 5 For 6 cars: K = 14, L = 2 K = 6, L = 4 K = 4, L = 6 For 3 cars: K = 16, L = 1 K = 14, L = 1 K = 12, L = 1 K = 6, L = 2 K = 4, L = 3 K = 2, L = 5 K = 2, L = 6 Therefore, new diagram with isoquants for cars is represented below. The points where isoquant of buses intersects with isoquant of cars indicate that specific combination of factors can be used in a full way with alternatives. Hence, for producing 7 buses it is required to buy 14 machines and hire 1 employee; meanwhile, the same number of equipment and staff can produce 3 cars. Also with a help of the diagram it can be seen, for example, that 2 employees can produce 3 cars, 5 or 10 buses according to different number of required machines. Hence, taking into account company’s product priorities along with availability and prices of machines, entrepreneur should assign production factors correctly. Therefore, a producer acquires alternatives for using combinations of machines and workers and makes a decision concerning the most effective implementation of these factors. Optimal combination of factors can be found in those points that lie on contract curve, which connects tangency points of isoquants of two alternative goods. Part (D) Currently, 3 staff and 8 machines make/repair cars. Explain whether there could be a better allocation of resources; and using the diagram you produced for Part (B) and Part (C), explain why the ‘contract curve’ is relevant to this question. If currently 3 staff and 8 machines make cars, then this combination of factors is considered to be effective one, because contract curve intersects stated point. This means that no any other allocations of resources are needed. Any deviation from the curve will be less effective for the company, because with such indicators all the resources are allocated fully and efficaciously providing maximum production of two products. The issue of contract curve is relevant to this question because as we can see on provided diagrams the company uses the same factors for producing different types of goods, which marginal rates of substitution in tangency points are equal (Arnold, 2008, p. 135). This achieves Pareto Optimality stating that it is impossible to use one factor better without making worse the usage of the second one. Reference List Arnold, R. A. (2008) Microeconomics. South-Western: Cengage Learning. Dwivedi, D.N. (2006) Microeconomics: Theory and Applications. India: Dorling Kindersley. Slavin, S. (2011) Microeconomics. New York: McGraw-Hill/Irwin. Read More
Cite this document
  • APA
  • MLA
  • CHICAGO
(“Microeconomics Essay Example | Topics and Well Written Essays - 1250 words”, n.d.)
Microeconomics Essay Example | Topics and Well Written Essays - 1250 words. Retrieved from https://studentshare.org/macro-microeconomics/1443616-microeconomy
(Microeconomics Essay Example | Topics and Well Written Essays - 1250 Words)
Microeconomics Essay Example | Topics and Well Written Essays - 1250 Words. https://studentshare.org/macro-microeconomics/1443616-microeconomy.
“Microeconomics Essay Example | Topics and Well Written Essays - 1250 Words”, n.d. https://studentshare.org/macro-microeconomics/1443616-microeconomy.
  • Cited: 0 times

CHECK THESE SAMPLES OF The Production Function for Buses - Edgeworth Box

The Socio-Political Background as Manifested in the Novels of Edgeworth

The Socio-Political Background as Manifested in the Novels of edgeworth Different writers write for different purposes and on different issues.... hellip; Though Maria edgeworth may generally be described as a fiction writer for most of her books such as Ormond, The Absentee and Castle Rackrent, she could only be described as a different fiction writer altogether.... This is because though writing on self-made stories, Maria edgeworth's stories are actually based on and crafted out of real life issues and events....
57 Pages (14250 words) Essay

Competitive Equilibrium in Exchange Economy

Title: Competitive equilibrium in an exchange economy and its representation using an edgeworth box Name: Course: Institution: In an exchange economy, it is every consumer's goal to be at a competitive advantage than all other consumers.... Competitive equilibrium in an exchange economy and its representation using an edgeworth box In an exchange economy, it is every consumer's goal to be at a competitive advantage than all other consumers.... In the exchange box, a contract curve indicates all the emerging points that are not under pareto optimality....
4 Pages (1000 words) Essay

Risk Aversion and the State Preference

The purpose of this paper “Risk Aversion and the State Preference” is to compare the State Preference and Machina triangle diagrams, explain an edgeworth box diagram, and discuss the factors that determine the efficient allocation of risk.... The expected utility model as an approach to the theory of individual behavior towards risk is distinctive due to the simplicity of its axioms, employing utility function and mathematical expectation, its utility functions such as risk aversion by concavity characterizing its various types of behavior (Machina 1982)....
8 Pages (2000 words) Assignment

Production and marketing functions

Lean manufacturing is an innovative strategy of the production function whereby wastage is minimized while maintaining quality in all the stages of the production process.... (2006) pointed out several objectives of the production function from which an organization can prioritize on the few that are likely to help it accomplish a competitive advantage.... Role of production function production function involves setting standards and objectives with regards to what is to be produced and the production process....
5 Pages (1250 words) Assignment

The Cobb-Douglas Production Function

In the paper “The Cobb-Douglas Production Function” the author depicted mathematically the production function.... the production function shows how a certain amount of inputs would lead to a certain amount of output.... the production function shows increasing, decreasing or constant returns.... the production function shows how a certain amount of inputs would lead to a certain amount of output while the corresponding cost function would show how the costs of those inputs would relate to the output....
6 Pages (1500 words) Admission/Application Essay

Evidence for the Suggestion that the Prion Protein May Function as Metal Binding Protein

This paper "Evidence for the Suggestion that the Prion Protein May function as Metal Binding Protein" discusses prion as a harmless neuronal copper-binding protein found in all vertebrates.... Micronutrient Copper is essential for neurological function (Stevens 2009)....
9 Pages (2250 words) Case Study

On the Production Function For Agriculture

This paper "On the production function for Agriculture" focuses on the fact that among the production functions, the Cobb-Douglas production function is the most widely used in theoretical and empirical analyses of growth and productivity (Felipe and Adams 2005, p.... the production function is discussed in Gujarati (2004, p.... In a way, the production function reflects the technological constraints or the production feasibility set (Varian 2006, pp....
5 Pages (1250 words) Research Paper

Designing a Box of Tricks

This term paper "Designing a box of Tricks" presents a design for a box of tricks with enough mechanisms which will be used to turn the input clockwise rotation of the wheel.... The materials used for the final design of the box should be the correct size as identified and designed.... Correct material helps in safety and easing the functionality of the box.... The materials used to make the box of tricks productThe materials used to make the box are locally available and they can be accessed with much ease....
4 Pages (1000 words) Term Paper
sponsored ads
We use cookies to create the best experience for you. Keep on browsing if you are OK with that, or find out how to manage cookies.
Contact Us