StudentShare
Contact Us
Sign In / Sign Up for FREE
Search
Go to advanced search...
Free

Macro economics - Research Paper Example

Cite this document
Summary
This paper talks about the states of national economies of China and India, which are considered as two of the most prominent emerging countries in the world today. Emerging markets are currently restructuring their economies along market-oriented lines and offer opportunities in different fields…
Download full paper File format: .doc, available for editing
GRAB THE BEST PAPER98.6% of users find it useful
Macro economics
Read Text Preview

Extract of sample "Macro economics"

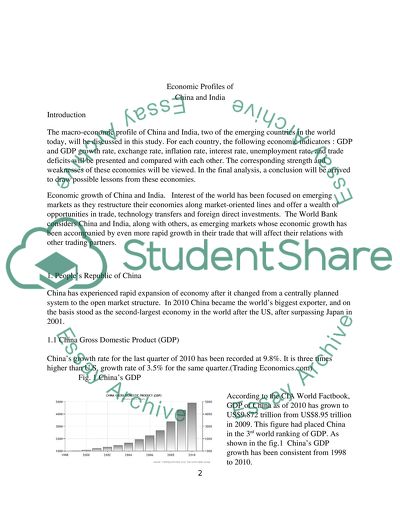
? Table of Contents Introduction 2 People’s Republic of China 2 India 5 Trends in each variables 7 Strengths and weaknesses of the economies 9 Conclusion 11 References 12 Economic Profiles of China and India Introduction The macro-economic profile of China and India, two of the emerging countries in the world today, will be discussed in this study. For each country, the following economic indicators : GDP and GDP growth rate, exchange rate, inflation rate, interest rate, unemployment rate, and trade deficits will be presented and compared with each other. The corresponding strength and weaknesses of these economies will be viewed. In the final analysis, a conclusion will be arrived to draw possible lessons from these economies. Economic growth of China and India. Interest of the world has been focused on emerging markets as they restructure their economies along market-oriented lines and offer a wealth of opportunities in trade, technology transfers and foreign direct investments. The World Bank considers China and India, along with others, as emerging markets whose economic growth has been accompanied by even more rapid growth in their trade that will affect their relations with other trading partners. 1. People’s Republic of China China has experienced rapid expansion of economy after it changed from a centrally planned system to the open market structure. In 2010 China became the world’s biggest exporter, and on the basis stood as the second-largest economy in the world after the US, after surpassing Japan in 2001. 1.1 China Gross Domestic Product (GDP) China’s growth rate for the last quarter of 2010 has been recorded at 9.8%. It is three times higher than U.S. growth rate of 3.5% for the same quarter.(Trading Economics.com) Fig. 1 China’s GDP According to the CIA World Factbook, GDP of China as of 2010 has grown to US$9.872 trillion from US$8.95 trillion in 2009. This figure had placed China in the 3rd world ranking of GDP. As shown in the fig.1 China’s GDP growth has been consistent from 1998 to 2010. Its GDP growth rate in 2010 has increased to 10.3% as compared to 9.3% in 2009 and 9% in 2008. (CIA Factbook). To make an illustration of the growth of its economy, the poverty rate of China as of 2011 is 2.8% as compared to 64% in 1981 (Zhang, Meng, 2007) Chinese GDP is made up of 46.8% industry, 43.6% services, and 9.6% agriculture. China’s main industries consist of mining iron, coal, aluminum and other metals, armament manufacturing, machine building, petroleum, textiles, automobiles, aircraft, communications and telecommunications, food processing and all sorts of consumer product manufacturing to name just a few. 1.2. Exchange rate. The official currency of the PRC is called Renmimbi which means “people’s money. It has an ISO 4217 code and symbol of ?. The Renmimbi has been traditionally pegged to the U.S. Dollar. The devaluation of the currency in 1980s to stimulate Chinese exports caused the currency decline from 1.50 in 1980 to 8.62 Yuan to a dollar in 1994. CIA reported following status of YUAN: In July 2005, China revalued its currency by 2.1% against the US dollar and moved to an exchange system that references a basket of currencies From 2005 to late 2008, cumulative appreciation of the renmimbi against US dollar was more than 20% China’s exchange rate remained pegged to the dollar from onset of global crisis In June 2010, Beijing allowed resumption of a gradual appreciation of renmimbi Source: CIA World Factbook Fig. 2. USDCNY Exchange rate Fig. 2 shows the Chinese Yuan Exchange Rate Chart (USDCNY) presenting the depreciation by 4.33 percent during the last 12 months. Source: Trading Economics.com Renminbi yuan (RMB) per US dollar - 6.7852 (2010) 6.8314 (2009) 6.9385 (2008) 7.61 (2007) 7.97 (2006) 1.3 Inflation rate. Report of Inflation in China as of March 2011 is 5.4 percent, a rise from previous 4.90. Record shows that from 1994 to 2010, the average inflation rate in China was 4.25 percent that went up to its highest rate of 27.70 percent in October of 1994 and a record low of -2.20. Inflation rate is explained as a general rise in prices measured against a standard level of purchasing power. 1.4 Interest rate on short term government debt. Fig. 3. China’s Interest Rate The prevalent benchmark interest rate reported in China is 6.31 percent. China’s average rate found on record from1996 until 2010, was 6.49 percent reaching an historical high of 10.98 percent in June of 1996 and a record low of 5.31 percent in February of 2002. In China, interest rates are decided upon by the People’s Bank China Monetary Policy. PBCMP has adopted two benchmark interest rates: one for year for lending and one year for deposit rate. China’s average interest rate was 6.49 percent from 1996 to 2010 with a highest interest rate of 10.98 percent in June of 1996 and a record low of 5.31 percent in February of 2002. 1.5 Unemployment rate. China has an unemployment rate of 4.3% as of 2009, but has leveled down to 4.1 % during the first month of 2011. Fig. 4. China’s Unemployment rate Source:Trading economics. com. http://www.tradingeconomics.com/china/interest-rate 1.6 Trade Deficit Fig. 5 Balance of Trade China has more exports than imports. In 2011 China has a trade surplus of equivalent to 140 million USD in March 2011. 39% of China’s GDP comes from its exports of goods and services. Source: Trading Economics The trade surplus has been a consistent scenario in China wherein the amount of goods and services exported to other countries are higher than the products imported from other countries. This means the country becomes very stable internally, and at same time, their currency performs well on the foreign exchange market. 2. India Fig. 6 GDP Growth Rate of India India is a country which has transformed from being autarkic to an open-market economy. In 1991, India introduced economic liberalization, including industrial deregulation, privatization of state-owned enterprises and reduced controls on foreign trade and investment. Since then, according to CIA World Facts, the country’s growth averaged more than 7% per year since 1997. In 2010, GDP is $4.06 trillion and a GDP growth rate of 8.3%. GDP is composed of agriculture 16%, industry 28.6% and services 55.3%. 2.1. Exchange rate. Fig. 7 India’s exchange rate The official currency of India is Rupee. As of April 2011, the Indian Rupee exchange rate is posted at 44.34, lower than previous 44.59. The Indian rupee has depreciated by 0.49 percent over the last 12 months. According to Trading Economies, from 1973 to 2011, the Indian Rupee has averaged 29.50 reaching a high record of 51.97 in March of 2009 and a record low of 7.19 in March of 1973. 2.2 Inflation rate. Fig. 7. India’s inflation rate. As of February 2011, inflation rate in India was posted at 8.82 percent. Referring to its record from 1969 to 2010, average inflation rate was 7.99 percent and had reached a record high of 34.68 percent in September of 1974 with a lowest record of -11.31 percent in May of 1976. The 1976 period could be considered a period of deflation, and its effect to the country is lowering of prices. Some ecoomists consider deflation more dangerous if it will continue in the long run because profitability of business declines. As decline continues, business will cut down in production causing unemployment, and at this point, economy will not expand anymore. 2.3 Interest rate on short term government debt. Fig. 8. India’s interest rate Records show the interest rate in India to be 5.75 as of 2010. Interest rates are decided by the Reserve Bank of India’s Central Board of Directors. From 2000 to 2010, the average interest rate in India was 5.82 that reached a highest point of 14.50 percent in Augut of 2000 and a record low of 3.25 percent in April of 2009 (Trading Economics) 2.4 Unemployment rate. Fig. 9 India’s unemployment rate Unemployment rate in India in 2009/2010 is posted at 9.4 percent. From records, India’s unemployment rate from 1982 to 2010 averaged 7.20 percent reaching the highest point of 8.30 in December 1983 and a record low of 5.99 percent in December of 1994. Source: Trading Economics 2.5 Trade deficit Fig. 10. India’s balance of trade As of 2011, India has a trade deficit is USD4982 million, which is an increased from previous year’s deficit of USD2600 million. India exports gems and jewelry, textiles, engineering goods, chemicals, leather manufactures and services. India imports foreign oil and coal for its energy needs and other products such as machinery, gems, fertilizers and chemicals. 3. Describe the trends in each variable. What do they mean for the economic conditions in each country? Contrast the trends between the two countries. VARIABLE India China 1. GDP Growth rate 8.3% 10.3% 2. Exchange rate INR44.34=$1 ?6.7852 to $1 3. Inflation rate 8.82% 6.31% 4. Interest rate 5.75% 6.31% 5. Unemployment rate 9.4% 4.3% 6. Trade deficit/surplus -USD4982 million $140million GDP is an important measure of the economy of a country. In the analysis, GDP growth shows that the economy of India and China is expanding and both have a positive GDP growth. This means that business, jobs and personal income of both countries are also growing. However, China is expanding more rapidly than India. In terms of GDP composition, India focuses more on service that accounts for 55.3% of its GDP while China has only 43.6% for service. China focuses more on industry because it has 46.8% while India has only 28.6%, and for India, agriculture matters most, having 16% of its GDP, and for India it only 9.6%. The difference of the exchange rate of China and India is a matter of monetary policy of both countries. China has pegged its currency to the U.S. Dollar and devalued its currency to benefit its exports. Critics observed that this Chinese policy made exports to the United States cheaper and exports to China more expensive, than it would be if it were done on free market conditions. This policy has also been criticized as the reason for the big U.S. deficit that is responsible for the loss of manufacturing jobs in U.S. Fig. 11. Country ranking by inflation rates Inflation rate is lower in China than in India. The average inflation rate for 10 years has stayed lower for China at 4.25% than India’s 7.99%. Inflation rate has been used by economists to denote the ongoing rise in the general level of prices quoted in units of money. This means with the U.S. dollar prices rising, a one-dollar bill buys less each year. So, with a different inflation rate, the price of similar kind of good is cheaper in China than India. However, when inflation rate is compared with other major economies, it will be seen that India has the highest inflation rate with China coming in as second. (Trading Economics) Interest rates are decisions made by the monetary board of each country. The Monetary Board of each country is charged with maintaining the stability of the nation’s financial system and could either raise or lower short term interest rates. These are actions done by the government to respond to the economic ups and downs that the country experiences and done on a regular basis. As shown, China charges higher interest rate than India. Higher interest rates have different impact. Certain rules are observed in interest rates adjustments and could also be used for comparison between China and India. First when the economy is growing, short term rates are raised to keep the economy from building too fast and risking inflation. China as compared to India is growing faster, and as an economic policy, has to raise interest to slow the economy (Bruce, L. 2009) China and India are two of the most populated countries in the world. China ranks first in terms of population followed closely by India. China has a labor force of 780 million while India has 478.3 million. However in terms of unemployment, India has a higher rate than China, meaning there is under utilization of labor and machinery in India. This could also be interpreted as the result of the GDP of both countries wherein it could be deduced that the economic output of India is far below what it would be under full utilization. The Balance of trade of China shows a consistent surplus while India has displayed varying degrees of deficit in trade over the years. A trade deficit means India imports more than what it exports. India is highly dependent on exports of oil whose prices have soared in the past decade. Deficit of India has declined in 2011 that means it is now undergoing recovery from recession which was hard in 2010. On the other hand, the protectionist’s policy of China proved to be highly successful in terms of its exports sales. China exported more than what it has imported from its trading partners abroad. 4. Describe the strengths and weaknesses that you see in these economies, based on these variables. STRENGTH AND WEAKNESSES CHINA Strength Available labor force. China has a vast labor force that is ready to support manufacturing and industry developments. It has a low unemployment rate and ranks 40th in the world comparison. China has control over its economy. The government is able to do this by a devaluation monetary policy that kept its exports in an advantage point. It has a favorable balance of trade that shows surplus of exports over imports thus making the economy stable. Import demands slowly rises up meaning domestic demand is also growing. Weakness Devaluation policy has been criticized by many of its trading partners because it has caused losses to their economy. Inflation rate stands high as compared with other major economies. A high rate of inflation is observed in China which is one of the characteristics associated with fast growing economies when the demand for goods and services is higher that the country’s productive capacity. INDIA Strength Availability of labor force. India has available work force to support development. It boasts of high literacy rate among its population and has a large base of educated English speaking population. Major exporter of information technology services and software workers. A large part of GDP of India comes from the services sector as it becomes a major source of overseas business processing. Immediate ability to rebound from global economic crisis. In 2009, India suffered a decline of its GDP because of the effect of the worldwide crisis. However, in just over a year, India’s economy is able to return to its pre-crisis level and is expected to remain strong. Weaknesses High inflation rate. India has the highest inflation rate when compared with the major economies of the world. According to CIA Factbook, industrial expansion and high food prices fueled the high inflation rate. High trade deficit. Despite efforts of the government, a high trade deficit still exists Long term challenges. India has to reckon with widespread poverty, inadequate physical infrastructure and limited opportunity for non-agricultural employment. 5. Conclusion Based on the GDP performances of China and India, it is clear that these countries have taken their lead in the economy and could rightly belong to be called an emerging economy. Its big population has been an asset instead of a destabilizing factor in the economy. There are talks that soon enough China will be able to overtake the U.S. in terms of economic development as what it did in China. But before China can achieve this status, it has to resolve issues concerning its devaluation policy that many countries are against. Government support counts most in stabilizing the economy. In China, a country in transition from a closed system to an open market system, government policies stabilizes its economy through monetary reforms. In India, a lot of infrastructure support for technological development is observed to become the leader in IT services. Services and industry have improved in India, but agriculture has been left behind in terms of share in GDP. Both countries have high inflation rates when compared to other major economies in the world. Economic policy states that this is highly possible for countries experiencing high growth of economy because of rapid expansion. High inflation raises prices of goods, but China is able to control this by artificial measure of devaluing its currency so that their produce can be priced lower in the market. But while the economies of both countries are improving, its internal effect to domestic consumption has problems. Unemployment rate is still high and poverty level must be addressed by the government. China has been able to dramatically reduce poverty level that could be seen as an effect of economic recovery, but poverty still exists in some areas. In India, it is quite intriguing that for a decade or more, it is able to contain unemployment average at 7.2 percent, and now that it is being considered emerging economy, a rise of unemployment is prominent and has risen above average. References Bruce, Laura. 2009. How interest rates are determined. Bankrate.com. http://www.bankrate.com/finance/cd/how-interest-rates-are-determined.aspx CIA. The World Factbook. 06 April 2011. Southeast Asia: India. Viewed 22 April 2011 https://www.cia.gov/library/publications/the-world-factbook/geos/in.html CIA. The World Factbook, 06 April 2011. China. Viewed 22 April 2011 Read More
Cite this document
  • APA
  • MLA
  • CHICAGO
(“Macro economics Research Paper Example | Topics and Well Written Essays - 2750 words”, n.d.)
Retrieved from https://studentshare.org/macro-microeconomics/1418226-macro-economics
(Macro Economics Research Paper Example | Topics and Well Written Essays - 2750 Words)
https://studentshare.org/macro-microeconomics/1418226-macro-economics.
“Macro Economics Research Paper Example | Topics and Well Written Essays - 2750 Words”, n.d. https://studentshare.org/macro-microeconomics/1418226-macro-economics.
  • Cited: 0 times

CHECK THESE SAMPLES OF Macro economics

Macro Economics of the Australian Reserve Bank

Name Institution Date Macro economics Introduction This paper focuses on the statements made to the media by Mr.... Glenn Stevens, the Governor of the Australian Reserve Bank concerning the monetary policy decisions by the Reserve Bank of Australia.... The statement was issued by the Reserve Bank's Governor on the 7th of February during a meeting with the organizations Board....
7 Pages (1750 words) Essay

Long-Term and Short-Term Interest Rates

Name: Instructor: Class name: Date: Micro and Macro economics 1.... Oil boom brings scarcity of workers in small towns http://www.... bcnews.... om/business/economywatch/oil-boom-brings-scarcity-workers-small-towns-940025 Chapter 1 terms and definitions: Opportunity cost Opportunity cost is the forgone alternative cost for another action....
8 Pages (2000 words) Assignment

Bonds, Inflation and Interest Rates

Name: Instructor: Class name: Date: Assignment 1 Article: http://www.... hanaweb.... om/GhanaHomePage/business/artikel.... hp?... D=272591 Terms: Bonds, Inflation and interest rates Application: The article states that Ghana investors have high affinity to long term bonds making provided that inflation is controlled....
8 Pages (2000 words) Assignment

Micro/Macro Economics

Kodak and xerox dominated the market for many years in this manner. Also, a company can build brand value or brand equity MICRO/Macro economics How might a firm in monopolistic competition increase its monopoly power?... Principles of economics.... A firm in monopolistic competition does not have monopoly power as such but can develop a certain degree of dominance in the market that is almost a monopoly....
2 Pages (500 words) Essay

Macro Economics of Australia

The author of this research proposal  "Macro economics of Australia " describes the inflation rate, the nominal exchange between Australia and The USA, gross fixed investment,  unemployment rate, money supply, treasure bonds, and bills.... The paper analyses the behavior of variables like rate of inflation, gross domestic product, gross investment, unemployment rate, private consumption....
10 Pages (2500 words) Research Proposal

Micro and Macro Economics

nbsp; HERE YOUR HERE HERE HERE Micro and Macro economics Economics is studying the of the world and why it operatesin the fashion that it does.... The author examines economics which is studying the state of the world and why it operates in the fashion that it does.... hellip; economics studies the relationship between market investments, interest rates, and other general finance issues as it pertains to a local economy or international economies and how all of these areas function or work together....
2 Pages (500 words) Essay

Micro and Macro Economics

 This paper analyses that generally after any organization increase wages then simultaneous they used to reduce the number of employees to maintain the balance in the profitability.... So the jobless workers used to join the companies where there is no existence of the union....  … Spillover effect is referred to the decrease in the wages of the non-union company....
4 Pages (1000 words) Assignment

Macro economics short answers

Structural unemployment is a kind of unemployment where, at a specified wage, the quantity of labor supplied is greater than the quantity of labor demanded.... This type unemployment caused by a mismatch between the needs of the employers and the attributes (for example skills,… This occurs due to some reasons namely; 2....
1 Pages (250 words) Essay
sponsored ads
We use cookies to create the best experience for you. Keep on browsing if you are OK with that, or find out how to manage cookies.
Contact Us