StudentShare
Contact Us
Sign In / Sign Up for FREE
Search
Go to advanced search...
Free

The Extent of Risk Aversion - Assignment Example

Cite this document
Summary
The paper "The Extent of Risk Aversion " highlights that generally, now, in both cases, the VNM utility of the uncertain income is smaller than the utility of the certain income. Therefore, it will now be rational for Mr. D to not cross speed limits…
Download full paper File format: .doc, available for editing
GRAB THE BEST PAPER96.3% of users find it useful
The Extent of Risk Aversion
Read Text Preview

Extract of sample "The Extent of Risk Aversion"

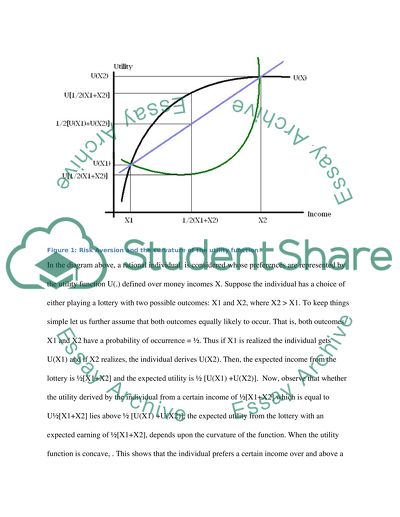
Risk aversion depends upon an individual’s relative preference for a certain income over a fair gamble entailing an expected income of the same value as the certain income. An individual is identified as being “risk averse” the certain income is preferred over a fair gamble with an expected income equal to the certain income. Individual’s preferring the fair lottery i.e., the risky option, over the certain income are on the other hand designated the status of being “risk-lovers”. Finally, individuals who are indifferent between a fair gamble with an expected income and a certain income of the same value are identified as being risk neutral individuals. Generally, the extent of risk aversion is the degree to which the individual prefers the certain income over the uncertain income. In terms of a utility function, this translates to the distance between the utility generated by the certain income and the utility generated by the gamble which has an expected income equal to the certain income. Obviously, for a concave utility function, the utility of the certain income will lie above the utility of the uncertain income with the same expected value. For a convex utility function this will be reversed. These are explained in the diagram below (figure 1). Figure 1: Risk Aversion and the curvature of the utility function In the diagram above, a rational individual is considered whose preferences are represented by the utility function U(.) defined over money incomes X. Suppose the individual has a choice of either playing a lottery with two possible outcomes: X1 and X2, where X2 > X1. To keep things simple let us further assume that both outcomes equally likely to occur. That is, both outcomes X1 and X2 have a probability of occurrence = ?. Thus if X1 is realized the individual gets U(X1) and if X2 realizes, the individual derives U(X2). Then, the expected income from the lottery is ?[X1+X2] and the expected utility is ? [U(X1) +U(X2)]. Now, observe that whether the utility derived by the individual from a certain income of ?[X1+X2] which is equal to U?[X1+X2] lies above ? [U(X1) +U(X2)], the expected utility from the lottery with an expected earning of ?[X1+X2], depends upon the curvature of the function. When the utility function is concave, . This shows that the individual prefers a certain income over and above a lottery with an expected income that is equal to certain income. Extending this logic it is simple to show that a risk loving individual will have a convex utility function while a risk neutral person will have a utility function that has a constant slope. Also, greater the distance between U?[X1+X2] and ? [U(X1) +U(X2)], the more risk averse is the individual, since the preference for the certain income is even greater in that case. This implies that the more concave the utility function the greater will be the risk aversion of the individual. Similarly, greater the convexity of the utility function, greater will be the individual’s love for risk. Therefore, it can be generally agreed upon that a risk-averse person will have a concave utility function while a risk lover will have a convex utility function. A risk neutral person’s preferences will be designated by a utility function with a constant slope. Now, Mr. D’s Utility function is: Then, and, Since , and thus, Mr. D’s utility function is positively sloped. A positively sloped utility function implies more income is preferred to less by Mr. D. For his attitude towards risk, the curvature (sign of the second order derivative) of the utility function has to be considered. Now, and, Therefore, the utility function is convex if the value of the positive parameter and it is concave if the positive parameter . If the utility function is concave, Mr. D is risk averse while if the utility function is convex, then Mr. D is in nature a risk loving person. Therefore, regarding the attitude of Mr. D towards risk, we conclude the following: Mr. D’s attitude towards risk depends on the value of the parameter . If , Mr. D loves risk while if Mr. D is a risk averse person. 2. We consider and . When with probability of getting caught , the Von Neuman Morgernstern (VNM) Utility, if Mr. D attempts to earn $100,000 is: . This is point D in figure 1. The utility of the certain income is: This is depicted as point C in figure 1. Figure 2: Utility function with alpha =1.25 Again, when with probability of getting caught, VNM utility if Mr. D attempts to earn $100,000 is: . This is point D in figure 2. The utility of the certain income is: This is depicted as point C in figure 2. Figure 3: Utility function with alpha=1.75 In both cases, we find that the gamble of speeding in the pursuit of trying to earn $100000 brings forth a utility that is substantially higher than the utility derived from the certain income of $50000. This is also reflected in the fact that the points reflecting the gambles are located higher on the utility curves. This should not be unanticipated since we had already noted for all values of the parameter , Mr. D is a risk lover and therefore, the risky option generates higher utility over certain incomes of equal value. 3. We consider and. When with probability of getting caught, the Von Neuman Morgenstern (VNM) Utility, if Mr. D attempts to earn $100,000 is: . This is point D in figure 3. The utility of the certain income is: This is depicted as point C in figure 3. Obviously, the expected VNM utility of trying to earn the higher income is smaller than the utility from the certain income. Figure 4: Utility function with alpha =0.25 Again, when with probability of getting caught, VNM utility if Mr. D attempts to earn $100,000 is: 3311.71. This is point D in figure 4. The utility of the certain income is: This is depicted as point C in figure 4. So, we find that the certain income is more attractive compared to the uncertain but potentially higher income earning option of over-speeding. Figure 5: Utility function with alpha=0.75 Now, in both cases, the VNM utility of the uncertain income is smaller than the utility of the certain income. Therefore, it will now be rational for Mr. D to not cross speed limits. This also makes sense, since as mentioned earlier for all values of the parameter alpha smaller than unity, Mr. D is a risk-averse individual. Therefore, his relative preference for certain incomes is now higher than an uncertain income of the same expected worth. Thus, now, Mr. D will choose not to speed. 4. If the police invest in security cameras so that the probability of getting caught rises substantially to 0.9 from 0.5, this will alter the VNM utilities. Since the probability of getting caught is higher and thus earning the higher income of $100000 is more unlikely, the VNM utilities will drop in all four cases. As we found that in the first two situations, Mr. D was a risk lover. However, whether his decisions will change or not has to be explored. For that purpose, we now compute the VNM utilities for the four different values of the parameter below. i) When with probability of getting caught, the Von Neuman Morgenstern (VNM) Utility, if Mr. D attempts to earn $100,000 is: . This is shown in figure 5 as point D’. Figure 6: The decline in VNM utility when probability of getting caught speeding rises for alpha=1.25 Recall that the utility derived from the certain income is: Therefore, now, the utility obtained from pursuing the certain income is greater for Mr. D. Therefore, his rational choice would be to stay within speed limits and ensure the earnings of $50,000. In figure 5 observe that the new point D’ corresponding to the VNM utility given the change in probability of getting caught lies lower than the point C representing the utility corresponding to the certainty income. ii) When with probability of getting caught, the Von Neuman Morgenstern (VNM) Utility, if Mr. D attempts to earn $100,000 is: . This is shown in figure 6 as point D’ Figure 7: The decline in VNM utility when probability of getting caught speeding rises for alpha=1.75 The utility obtained from the certain income of $50,000 by Mr. D here is: Thus, it would be rational in this case to stay within speed limits and go for the certain income of $50000 as well. In the diagram above (figure 6) we find that the point that corresponds to the VNM utility given the updated probability of getting caught, D’ is associated with a utility level lower than that corresponding to the utility obtained from the certain income of $50000, C. iii) When with probability of getting caught, the Von Neuman Morgenstern (VNM) Utility, if Mr. D attempts to earn $100,000 is: . Thus, the updated VNM utility falls from 13.77 to 10.78. The utility from pursuing the certain income is: , which is higher that obtained from the risky alternative. The utility obtained from the certain income was higher when the probability of getting caught was 0.5 and so pursuing the certain income had been rational initially. In this case that decision remains the same. It is still rational to pursue the certain income since Mr. D is risk averse and the risk of pursuing the higher income of $100000 has become riskier. The change is depicted in the diagram below. In figure 7, D’ represents the VNM utility level that corresponds to the modified probabilities. Figure 8: The decline in VNM utility when probability of getting caught speeding rises for alpha = 0.25 iv) When with probability of getting caught, the Von Neuman Morgenstern (VNM) Utility, if Mr. D attempts to earn $100,000 is: . Thus, the updated VNM utility falls from 3311.71 to. This change is shown in the diagram below (figure 8) as the movement from point D (the initial VNM utility when probability of getting caught was 0.5) to point D’ (reflecting the VNM probability obtained when the probability of getting caught is 0.9. Figure 9: The decline in VNM utility when probability of getting caught speeding rises for alpha = 0.75 Recall that Mr. D can get a utility of 3343.70 from pursuing the certain income. The utility obtained from the certain income was higher even when the probability of getting caught was as low as 0.5 and thus going for attaining the certain income of $50000 remains the optimal decision even now. To conclude, note that the effect of police installing the cameras is that going for the higher income of $100,000 becomes relatively riskier. The risk of getting caught now is so high that even when Mr. D is risk loving, the alternation in the probability of getting caught influences his decision. The VNM utility from going for the higher income is lower than the utility from the certain income of $50,000. Thus due to the change in the probability of getting caught, the certain income becomes more preferable. When Mr. D is risk averse, the certain income was more preferable from the outset, and thus the change in the probability does not modify his decision. Mr. D sticks to his original decision of pursuing the certain income. Therefore, with an updated probability of getting caught being as high, Mr. D chooses the certain income for all four values of the parameter we have considered here. References: Ison, S & Stuart Wall (2006) “Economics”, 4th edition, Prentice Hall Gibbons, R., (1992) “Game Theory for Applied Economists”, Princeton University Press Kreps, D.M., (1990) “Game Theory and Economic Modelling”, Oxford University Press Varian, H.R., (1997) “Intermediate Microeconomics”, W.W. Norton and Company, New York Appendix: Excel sheet Income U(a = 0.25) U(a = 0.75) U(a=1.25) U(a=1.75) 10000 10 1000 100000.00 10000000.00 15000 11.0668192 1355.403 166002.29 20331045.08 20000 11.89207115 1681.793 237841.42 33635856.61 25000 12.5743343 1988.177 314358.36 49704420.55 30000 13.16074013 2279.507 394822.20 68385211.71 35000 13.677824 2558.887 478723.84 89561029.60 40000 14.14213562 2828.427 565685.42 113137084.99 45000 14.56475315 3089.651 655413.89 139034282.21 50000 14.95348781 3343.702 747674.39 167185076.24 55000 15.31407157 3591.468 842273.94 197530747.23 60000 15.6508458 3833.659 939050.75 230019517.53 65000 15.96718434 4070.849 1037866.98 264605199.68 70000 16.26576562 4303.517 1138603.59 301246194.95 75000 16.5487546 4532.063 1241156.59 339904732.20 80000 16.81792831 4756.828 1345434.26 380546276.80 85000 17.07476485 4978.107 1451355.01 423139062.98 90000 17.32050808 5196.152 1558845.73 467653718.04 95000 17.55621543 5411.189 1667840.47 514062956.06 100000 17.7827941 5623.413 1778279.41 562341325.19 p=0.5 p=0.9 VNM(a=0.25) 13.89139705 10.77828 U(50000,a=0.25) 14.95348781 VNM(a=0.75) 3311.706626 1462.341 U(50000,a=0.75) 3343.701525 VNM(a=1.25) 939139.705 267827.9 U(50000,a=1.25) 747674.3906 VNM(a=1.75) 286170662.60 65234133 U(50000a=1.75) 167185076.2 Read More
Cite this document
  • APA
  • MLA
  • CHICAGO
(“Risk aversion Assignment Example | Topics and Well Written Essays - 2000 words”, n.d.)
Retrieved from https://studentshare.org/macro-microeconomics/1398038-no-title
(Risk Aversion Assignment Example | Topics and Well Written Essays - 2000 Words)
https://studentshare.org/macro-microeconomics/1398038-no-title.
“Risk Aversion Assignment Example | Topics and Well Written Essays - 2000 Words”, n.d. https://studentshare.org/macro-microeconomics/1398038-no-title.
  • Cited: 0 times

CHECK THESE SAMPLES OF The Extent of Risk Aversion

Investor Psychology and Return Predictability

To do so, we start with a traditional constant relative risk aversion utility function.... ) When an investor may allocate his wealth to the indices and to the risk-free asset, then the weights corresponding to the risky assets are essentially unaffected by the introduction of a concern for the third or fourth moments....
11 Pages (2750 words) Essay

Risk Aversion and the State Preference

The purpose of this paper 'risk aversion and the State Preference' is to compare the State Preference and Machina triangle diagrams, explain an Edgeworth Box diagram, and discuss the factors that determine the efficient allocation of risk.... risk aversion refers to the investor preferring less risk to more risk.... The expected utility model as an approach to the theory of individual behavior towards risk is distinctive due to the simplicity of its axioms, employing utility function and mathematical expectation, its utility functions such as risk aversion by concavity characterizing its various types of behavior (Machina 1982)....
8 Pages (2000 words) Assignment

The Phenomenon of the Equity Premium Puzzle

Myopic loss aversion is a behavioral finance approach used to explain the size of equity risk premium.... The concept of myopic loss aversion rests on two principals It includes the cognitive and unconscious operations used by people to organize, evaluate and keep track of financial activities.... Its example is that individuals are highly risk-averse, they get more pain from shocks as compared to the pleasure they get from profit.... Moreover, if an investor has the risk-averse preferences then the time horizon over which he evaluates his portfolio also impacts his investment preferences....
14 Pages (3500 words) Assignment

Management School: Corporate Governance

The first area includes the improvement on risk management practice.... This essay declares that many corporate governance scandals have arisen because of a few individuals abusing their position within an organization.... The falling of these firms and companies have led to assessing of the UK Corporate Governance Code to the current 2014 version....
8 Pages (2000 words) Essay

Why does the Type of Branding Affect Consumer Purchasing Behaviour

The author of the current paper states that consumer behavior is partly unpredictable, though in some cases the type of branding might affect the purchasing behavior of the consumer.... There are different sections of the consumer in a society formed according to the basis of monthly household income....
17 Pages (4250 words) Case Study

The New Arsenal of Risk Management

The capital asset pricing model (CAPM) is a model that establishes the equilibrium relationship between the risk and return on a risky asset.... o measure the performance contribution from actively managing an investment portfolio, an equilibrium model can be used, that takes into account the systematic risk and its reward by the market.... These theories give the risk-return menu, which each fund manager can achieve through a passive portfolio strategy....
12 Pages (3000 words) Research Paper

Risk Management Approaches at Jet Propulsion

From the analysis, it is evident that JPL practices fail to meet the required risk management standards of practice, especially in their general protocol of risk assessment and risk preparedness.... The paper 'risk Management Approaches at Jet Propulsion " is a great example of a management case study.... This study seeks to address the different risk assessment and risk management approaches as practiced in the Jet Propulsion Laboratory (JPL)....
18 Pages (4500 words) Case Study

Risk Preference

For example, through risk aversion, risk neutrality, and risk-seeking.... Moreover, the research will discuss the most shared observed approaches of risk.... Therefore, one important factor to be considered is the need for individuals to accept different types of risk.... he research paper generally looks at the various theory of risk methods.... The paper 'risk Preference' is a meaningful example of a finance & accounting literature review....
12 Pages (3000 words) Literature review
sponsored ads
We use cookies to create the best experience for you. Keep on browsing if you are OK with that, or find out how to manage cookies.
Contact Us