StudentShare

Our website is a unique platform where students can share their papers in a matter of giving an example of the work to be done. If you find papers
matching your topic, you may use them only as an example of work. This is 100% legal. You may not submit downloaded papers as your own, that is cheating. Also you
should remember, that this work was alredy submitted once by a student who originally wrote it.
✕
Free
Cost Structure: Break-Even Point and Target Profits - Assignment Example
Summary
The paper "Cost Structure: Break-Even Point and Target Profits" is a great example of a finance and accounting assignment. In a contribution format income statement, different expenses are excluded from the total revues of the business for arriving at the contribution margin…
- Subject: Finance & Accounting
- Type: Assignment
- Level: Masters
- Pages: 5 (1250 words)
- Downloads: 0
- Author: erichkunde
Extract of sample "Cost Structure: Break-Even Point and Target Profits"
Number: Paper: Case Study 5-32: Cost Structure: Break Even Point and Target Profits a. In a contribution format income statement, different expenses are excluded from the total revues of the business for arriving at the contribution margin. From the margin, fixed expenses are deducted to obtain the net profit/loss of the business for a particular period of time (Warren, Reeve and Duchac, 2012; Baker and English, 2011; Chandra, 2005; Dayananda, et al., 2002).
The following table highlights the budgeted contribution margin income statement of Marston Corporation when the sales commission of the independent sales agent is 18%:
Contribution format income statement
Sales
$ 30,000,000.00
(-) Variable cost
$ 22,800,000.00
Contribution
$ 7,200,000.00
(-) Fixed cost
$ 6,800,000.00
Net profit
$ 400,000.00
When the sales commission of the independent sales agent is 18%, the net profit of the business is observed to be $400,000.
1. b.
The following table highlights the budgeted contribution margin income statement of Marston Corporation when the sales commission of the independent sales agent is 20%:
Contribution format income statement
Sales
$ 30,000,000.00
(-) Variable cost
$ 23,400,000.00
Contribution
$ 6,600,000.00
(-) Fixed cost
$ 6,800,000.00
Net loss
$ (200,000.00)
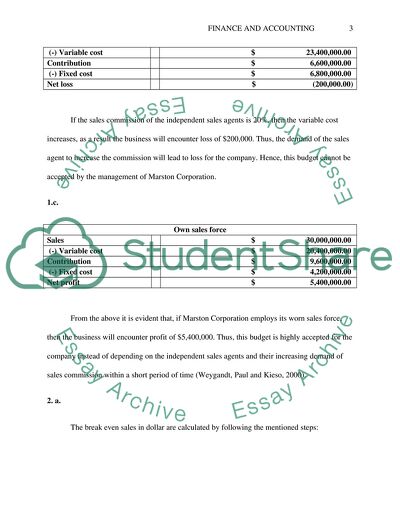
If the sales commission of the independent sales agents is 20%, then the variable cost increases, as a result the business will encounter loss of $200,000. Thus, the demand of the sales agent to increase the commission will lead to loss for the company. Hence, this budget cannot be accepted by the management of Marston Corporation.
1.c.
Own sales force
Sales
$ 30,000,000.00
(-) Variable cost
$ 20,400,000.00
Contribution
$ 9,600,000.00
(-) Fixed cost
$ 4,200,000.00
Net profit
$ 5,400,000.00
From the above it is evident that, if Marston Corporation employs its worn sales force, then the business will encounter profit of $5,400,000. Thus, this budget is highly accepted for the company instead of depending on the independent sales agents and their increasing demand of sales commission within a short period of time (Weygandt, Paul and Kieso, 2000).
2. a.
The break even sales in dollar are calculated by following the mentioned steps:
i) Contribution margin ratio is calculated by dividing Sales by contribution margin (Cafferky, 2010).
ii) Break-even point in sales in dollars is calculated by dividing total fixed cost by break-even point (Shapiro, 2008).
Commission = 18%
Contribution margin ratio
24%
Break-even point in sales dollar
$ 28,333,333.33
When the sales commission of the independent sales agent is 18%, the break-even point sales are $28,333,333.
2.b.
Commission = 20%
Contribution margin ratio
22%
Break-even point in sales dollar
$ 30,909,090.91
When the sales commission of the independent sales agent is 18%, the break-even point sales are $30,909,090. The break-even sales have increased.
2.c.
Own sales force
Contribution margin ratio
32%
Break-even point in sales dollar
$ 13,125,000.00
If Marston Corporation employs its own sales force then the break-even point sales is less than the other two options. This implies the fact that, company will earn profit earlier if it employs its sales force than to depend on the sales agents.
3.
Now, if the company employs its own sales force and wants to keeps the same net operating income same as $200, 0000 it has to follow few steps. Let the sales volume be $x. Hence, the net operating income of Marston Corporation can be evaluated with the help of the following steps:
X = Variable cost + contribution
= $(17400000+5400000+6000000)
= $ 28800000
Hence the sales volume will be $ 28800000.
4.
When Marston Corporation employs its own sales force then the net operating profit is $5400000; whereas when they are dependent on the sales agent then the net operating loss is $200000. The sales volume of the company when the operating income is equal regardless of employing sales agent or sales force is $ 35745600.
5. The profit and sales revenue of both the alternatives are depicted in the graph provided below:
Figure 1: Commission 20% Vs Own sales force
(Source: Author’s creation)
The sales revenue and profit graph of both the alternatives highlights the fact that employing own sales force will be a better option than to depend on the independent sales force. If the management of Marston Corporation remains dependent on the sales agents and their demand keeps on changing, then the company will encounter loss for the period. Thus, it can be concluded that the management can employ its own sales force in order to earn profit and avoid the burden of increasing demand of the sales agents.
6. Memo
Date:
To: President
From:
SUBJECT: RECOMMENDATION WHETHER TO EMPLOY OWN SALES FORCE OR DEPEND ON THE SALES AGENT
Marston Corporation aims at manufacturing disposable thermometer and sold them to hospitals. The company sells the products through the independent sales agents, who are located in Canada and United States. The sales agents are associated with the company and do not come under its direct payroll. Thus, they are provided with a percentage of the profit as sales commission. The independent sales force of Marston Corporation is demanding for increased sales commission each year, which is a big issue as the sales of disposable thermometer is expected to remain constant. Thus, with the same sales revenue it is difficult for the company to increase the percentage of sales commission. It is observed in the budgeted income statement that when the sales commission is 18% of the sales revenue, then the net operating income or the operating profit is $ 4,00,0000. 18% sales commission is the initial demand of the sales agent and it is noticed that they have demanded for increasing the percentage in last five years. Hence, it is serious issue for the financial health of the company. In order to manage the situation, the management can think of replacing the independent sales agent with its own sales force (Joehnk, 2012).
After investigating both the situation (Commission 20% and own sales force), it can be concluded that the company can adopt the second alternative. About eight sales representatives can be employed for selling the thermometers in the hospitals. The annual payroll for the sales force is expected to be $7, 00,000. The sales managers and staffs are also required for the successful operation of the company and profit at the end of the year. The total net operating income of the company, when the sales commission is 20% is lower than if it hires it own sales force. The percentage of sales commission provided to sales force is 10% which is lower than the demand of the independent sales force. It is highly recommended that the management should hire its own sales force in order to maintain a stable and considerable net operating income.
Case Study 8-28: Evaluating a Companys Budget Procedure
1. Problems and its effect on the effectiveness of the budgetary control system
A budget is a blueprint of a plan that is expressed in monetary terms prepared for a certain period of time (FAO Corporate Document Repository, n.d.; Bierman and Smidt, 2007). It is eventually a systematic plan that describes the utilization of resources of a company. Ferguson & Son Manufacturing Company has encountered worst situation regarding its financial condition as manufacturing department failed to meet the budget prepared for the effectiveness of the company. The departmental budgets are prepared to encourage the workers and supervisors to increase efficiency. The controller has always instructed the staffs to tighten the budget. The staffs are not able to complete the assigned work on time as the big jobs are interrupted by small contracts. This is reducing the efficiency of the system as the machines are adjusted constantly. This adjustment times is included within the idle time of the workers. The breakdown of the hydraulic press has affected the production of the company as the maintenance department could not repair the machines at the right time. Hence, it can be stated that the company has not used an efficient budgetary control system, which can take consider both the budget and time constraint.
2. Revision of the budgetary control system
The budgetary control system of Ferguson & Son Manufacturing Company should be revised in order to make it efficient enough for production purpose. The company should control the budget in such a way that the big and small orders are managed at the same time. It is only possible when the company will make separate arrangements for big and small orders. This will help in eliminating idle time and the budgets are also met. The purchase of the machinery should be considered within the budgeted amount so as to manage the cash flow efficiently.
References
Baker, K. H. and English, P. (2011). Capital Budgeting Valuation. New Jersey: John Wiley & Sons.
Bierman, H. and Smidt, S. (2007). The Capital Budgeting Decision. New York: Routledge.
Cafferky, M. (2010). Breakeven analysis: The definitive guide to cost-volume-profit analysis. New York: Business Expert Press.
Chandra, P. (2005). Fundamentals of Financial Management. New Delhi: Tata McGraw-Hill.
Dayananda, D., Irons, R., Harrison, S., Herbohn, J. and Rowland, P. (2002). Capital Budgeting. Cambridge: Cambridge University Press.
FAO Corporate Document Repository. (no date). Chapter 4 - Budgetary control. Retrieved from http://www.fao.org/docrep/w4343e/w4343e05.htm
Joehnk, G. (2012). Fundamentals of Investing. New Jersey: Pearson Education.
Shapiro, C. A. (2008). Capital Budgeting and Investment Analysis. New Delhi: Pearson Education India.
Warren, C., Reeve, C. and Duchac, J. (2012). Managerial accounting. Connecticut: Cengage Learning.
Weygandt, J., Paul, K. and Kieso, D. (2000). Managerial accounting: Tools for business decision making. New Jersey: John Wiley & Sons.
Read
More
sponsored ads
Save Your Time for More Important Things
Let us write or edit the assignment on your topic
"Cost Structure: Break-Even Point and Target Profits"
with a personal 20% discount.
GRAB THE BEST PAPER
