StudentShare
Contact Us
Sign In / Sign Up for FREE
Search
Go to advanced search...
Free

Financial Statement Analysis for Tesco Plc - Example

Cite this document
Summary
In this regard, a comparison of the liquidity and profitability ratios for the two companies has been carried out. Based on the analysis carried out in this report,…
Download full paper File format: .doc, available for editing
GRAB THE BEST PAPER96% of users find it useful
Financial Statement Analysis for Tesco Plc
Read Text Preview

Extract of sample "Financial Statement Analysis for Tesco Plc"

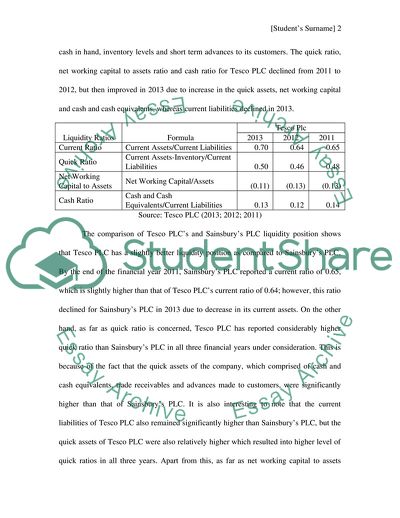
Financial ment Analysis Introduction Following is a comprehensive comparative analysis of the financial performance of Tesco PLC and Sainsbury’s PLC. In this regard, a comparison of the liquidity and profitability ratios for the two companies has been carried out. Based on the analysis carried out in this report, recommendation and conclusion have been presented at the end of this report. Liquidity Ratios Using its short term or current assets uses the liquidity ratios to understand the ability of a company discharge its short-term obligations and liabilities. As per the financial information provided in the financial statements of Tesco PLC, it has been noted that the company’s liquidity position has deteriorated from the financial year 2011 to 2012. In 2011, the current ratio of Tesco PLC was 0.65, which declined to 0.64 in the financial year 2012 due to significant increase in its current liabilities. Apart from this, there has been an increase in the current ratio in 2013, as current liabilities decreased and current assets increased. Apart from current ratio, similar trends have been noted with regard to quick ratio, net working capital to assets ratio and cash ratio. It is pertinent to note here that the liquidity ratios increased in 2013 because the company increased its cash in hand, inventory levels and short term advances to its customers. The quick ratio, net working capital to assets ratio and cash ratio for Tesco PLC declined from 2011 to 2012, but then improved in 2013 due to increase in the quick assets, net working capital and cash and cash equivalents, whereas current liabilities declined in 2013. Liquidity Ratios  Formula Tesco Plc 2013 2012 2011 Current Ratio Current Assets/Current Liabilities 0.70 0.64 0.65 Quick Ratio Current Assets-Inventory/Current Liabilities 0.50 0.46 0.48 Net Working Capital to Assets Net Working Capital/Assets (0.11) (0.13) (0.13) Cash Ratio Cash and Cash Equivalents/Current Liabilities 0.13 0.12 0.14 Source: Tesco PLC (2013; 2012; 2011) The comparison of Tesco PLC’s and Sainsbury’s PLC liquidity position shows that Tesco PLC has a slightly better liquidity position as compared to Sainsbury’s PLC. By the end of the financial year 2011, Sainsbury’s PLC reported a current ratio of 0.65, which is slightly higher than that of Tesco PLC’s current ratio of 0.64; however, this ratio declined for Sainsbury’s PLC in 2013 due to decrease in its current assets. On the other hand, as far as quick ratio is concerned, Tesco PLC has reported considerably higher quick ratio than Sainsbury’s PLC in all three financial years under consideration. This is because of the fact that the quick assets of the company, which comprised of cash and cash equivalents, trade receivables and advances made to customers, were significantly higher than that of Sainsbury’s PLC. It is also interesting to note that the current liabilities of Tesco PLC also remained significantly higher than Sainsbury’s PLC, but the quick assets of Tesco PLC were also relatively higher which resulted into higher level of quick ratios in all three years. Apart from this, as far as net working capital to assets ratios for the two companies are concerned, it can be observed that Tesco PLC was ahead in this regard too; however, Sainsbury’s PLC reported higher cash reserves relative to its current liabilities and therefore remained ahead of Tesco PLC in this regard. Liquidity Ratios Formula  Sainsburys Plc 2013 2012 2011 Current Ratio Current Assets/Current Liabilities 0.61 0.65 0.58 Quick Ratio Current Assets-Inventory/Current Liabilities 0.29 0.35 0.30 Net Working Capital to Assets Net Working Capital/Assets (0.09) (0.09) (0.11) Cash Ratio Cash and Cash Equivalents/Current Liabilities 0.16 0.24 0.17 Source: Sainsbury PLC (2013; 2012; 2011) From the financial year 2011 to 2013, the net working capital to assets ratio for Tesco PLC and Sainsbury’s PLC remained negative, which is indicative of the fact that the net current liabilities remained high for both companies in comparison with their respective current assets. On the other hand, the trend noted in relation to net working capital to total assets of Tesco PLC indicates that as the gap between current liabilities and current assets decreased in 2013, the ratio indicated slight improvement. On the other hand, for Sainsbury’s PLC, the net working capital to assets ratio deteriorated further in 2013, after showing some improvement in 2012, due to decline in its current assets. Lastly, a comparative analysis of the cash ratio for two companies indicates that Tesco PLC’s cash ratio is slightly lower than that of Sainsbury’s PLC. The primary reason behind this difference is that Sainsbury’s PLC maintained a better level of cash reserves in comparison with its current liabilities. Profitability Ratios These ratios are indicative of the profitability of a business entity after taking into accounts sales revenues, costs, gross and net margins and other related figures. The ratio shows the extent to which a business has actually earned over a particular period of time from its operations. In this regard, there are six ratios calculated for both Tesco PLC and Sainsbury’s PLC for the last three financial years, which include operating profit margin, gross profit margin, net profit margin, return on assets, return on equity and return on capital of the two companies. The operating profit margin for Tesco PLC has declined on a consistent basis during the past three years. As for instance, the operating profit margin for Tesco PLC has been determined to be 6.48 %, 6.17 % and 3.37 % in 2011, 2012 and 2013 respectively. This decline has been noted due to considerably higher operating expenses of the company, which have grown sharply during the last three years. Apart from the fact that the revenues earned by the company were high and showed growth, the cost of operating for Tesco PLC diminished the impact of higher revenues. In addition to this, the cost of sales for Tesco PLC has also increased in the past three years at a greater pace than the growth in its revenues. Apart from this, the return on assets, equity and capital for Tesco PLC remained stable from 2011 till 2012, but there has been a significant decline noted in 2013 due to significant decline in the net profits of the company. Profitability Ratios  Formula Tesco PLC 2013 2012 2011 Operating Profit Margin Operating Profit / Sales 3.37 % 6.17 % 6.48 % Gross Profit Margin Gross Profit / Sales 6.31 % 8.36 % 8.37 % Net Profit Margin Net Profit / Sales 0.18 % 4.36 % 4.42 % Return on Assets Net Profit / Total Assets 0.24 % 5.54 % 5.66 % Return on Equity Net Profit / Total Equity 0.24 % 5.54 % 5.66 % Return on Capital Net Profit / Total Capital 0.38 % 8.90 % 9.06 % Source: Tesco PLC (2013; 2012; 2011) On the other hand, Sainsbury’s PLC showed mixed trends in relation to its profitability ratios. As for instance, operating profit margin and net profit margin declined in 2013, whereas gross profit margin increased in the same year. The reasons behind these trends are that the company managed to control its cost of sales relative to sales revenues generated in 2013, whereas the operating expenses and finance and tax expenses continued to rise in 2013, which ultimately posed an unfavorable impact on operating profit margin and net profit margin. Apart from this, the return on assets, equity and capital for Sainsbury PLC have shown decline from 2011 till 2013, due to decrease in its net profits. Although there has been a consistent decline in these three ratios, but at the same time it can be observed that the company managed to lower down its percentage decrease in these returns. Profitability Ratios  Formula Sainsbury’s PLC 2013 2012 2011 Operating Profit Margin Operating Profit / Sales 3.81 % 3.92 % 4.03 % Gross Profit Margin Gross Profit / Sales 5.48 % 5.43 % 5.50 % Net Profit Margin Net Profit / Sales 2.63 % 2.68 % 3.03 % Return on Assets Net Profit / Total Assets 4.84 % 4.85 % 5.61 % Return on Equity Net Profit / Total Equity 4.84 % 4.85 % 5.61 % Return on Capital Net Profit / Total Capital 6.41 % 6.50 % 7.57 % Source: Sainsbury’s PLC (2013; 2012; 2011) The comparative analysis of profitability ratios determined for the two companies indicates that Sainsbury’s PLC has been placed in a better position as compared to Tesco with regard to all profitability ratios determined, except for the gross profit margin. Recommendations From the above financial ratio analysis including liquidity and profitability analyses of two UK based retail companies including Tesco Plc. and Sainsbury’s Plc. the following conclusions along with recommendations are generated. 1. Tesco Plc.’s overall liquidity position has remained stronger than Sainsbury’s Plc. Except cash and cash equivalent/current liabilities ratio, other liquidity ratios have better values for Tesco Plc. as compared to Sainsbury’s Plc. However, both companies have current ratio less than 1 and they hold a large inventory value at the end of the three years of analysis. This makes them relatively weak companies in terms of liquidity. It is recommended to both companies that they should not only focus on reducing their operating costs, but also improve their net working capital position to free up cash and invest in restructuring of their business model. Particularly, Tesco Plc. has faced major challenges in terms of its international expansion and it is recommended to focus more on its core UK market. Other companies particularly Sainsbury’s Plc, Asda, and Aldi have improved their position in the UK retail industry when Tesco has been struggling to generate higher returns from its investment in overseas markets. 2. Profitability analysis conducted in this report suggests that there is a mixed trend in the last three years. However, overall it can be stated that the profitability position of Tesco Plc. has deteriorated in the last three years. On the other hand, Sainsbury’s Plc. has maintained its profitability position. This is mainly due to the losses that Tesco Plc. incurred in its international business including the US. Furthermore, Sainsbury’s Plc. has been more active in expanding its network of convenient stores and online shopping in the UK where Tesco Plc. has lacked its focus in the recent years. On the basis of the analysis, it is recommended to shareholders that there should be careful with their investment in Tesco Plc. as it has incurred a major slowdown in its businesses and losses have been recorded in the company’s income statement due to the closure of its US operations. The company has recently announced major changes in its UK business model including closure of certain huge stores with low returns, focusing on online shopping portal, and opening up convenient stores across the UK. If there is a turnaround observed in the coming months for Tesco Plc. then it will be a definite buy as the company has proven its ability in the last few decades to stay at the top. Till then, investment in Sainsbury’s Plc’ stocks are preferred and recommended on the basis of the analysis presented in this report. Conclusion This report presented a financial performance analysis of Tesco PLC and Sainsbury’s PLC with respect to their liquidity and profitability during the past three financial years, i.e. from 2011 to 2013. The comparative analysis of liquidity positions of the two companies during the past three years has concluded that Tesco PLC has been placed in a better position as compared to Sainsbury’s PLC, as the company has been able to maintain a relatively better ratio between its current assets and current liabilities during the past three financial years. On the other hand, Sainsbury’s PLC had reported improvements in its liquidity position in 2012, but due to considerable increase in its current liabilities, the company could not maintain its improvement trend in 2013. As far as profitability is concerned, it has been concluded that Sainsbury’s PLC has been ahead of Tesco PLC, except for the gross profit margin ratio. Works Cited Sainsburys PLC. Annual Report 2011. Financial Statements. London: Sainsburys PLC, 2011. —. Annual Report 2012. London: Sainsburys PLC, 2012. —. Annual Report 2013. London: Sainsburys PLC, 2013. Tesco PLC. Annual Report 2011. Financial Statements. London: Tesco PLC, 2011. —. Annual Report 2012. Performance review. Tesco PLC. Herdforshire: Pureprint Group Ltd, 2012. —. Annual Report 2013. Herdfordshire: Pureprint Group Ltd, 2013. Appendix A: Financial Ratio Analysis   Tesco Plc Sainsburys Plc Liquidity Ratios 2013 2012 2011 2010 2013 2012 2011 2010 Current Ratio 0.7 0.64 0.65 0.73 0.61 0.65 0.58 0.66 13,096 12,353 11,608 11,765 1,901 2,032 1,708 1,853 18,703 19,180 17,731 16,015 3,115 3,136 2,942 2,793 Quick Ratio 0.5 0.46 0.48 0.56 0.29 0.35 0.3 0.41 13,096 12,353 11,608 11,765 1,901 2,032 1,708 1,853 3,744 3,598 3,162 2,729 987 938 812 702 18,703 19,180 17,731 16,015 3,115 3,136 2,942 2,793 Net Working Capital to Assets -0.11 -0.13 -0.13 -0.09 -0.1 -0.09 -0.11 -0.09 -5,607 -6,827 -6,123 -4,250 -1,214 -1,104 -1,234 -940 50,129 50,781 47,206 46,023 12,695 12,340 11,399 10,855 Cash Ratio 0.13 0.12 0.14 0.18 0.17 0.24 0.17 0.3 2,512 2,305 2,428 2,819 517 739 501 837 18,703 19,180 17,731 16,015 3,115 3,136 2,942 2,793                   Efficiency Measures 2013 2012 2011 2010 2013 2012 2011 2010 Receivables Turnover 25.67 24.29 25.95 30.14 76.2 78 61.5 92.86 64,826 64,539 60,455 56,910 23,303 22,294 21,102 19,964 2,525 2,657 2,330 1,888 306 286 343 215 Receivables Turnover Period 14.22 15.03 14.07 12.11 4.8 4.7 5.9 3.93 25.67 24.29 25.95 30.14 76.2 78 61.5 92.86 Inventory Turnover 16.22 16.48 17.5 19.17 22.3 22.5 24.6 26.9 60,737 59,278 55,330 52,303 22,026 21,083.00 19,942.00 18,882 3,744 3,598 3,162 2,729 987 938 812 702 Inventory Turnover Period 22.5 22.15 20.86 19.04 16.4 16.2 14.9 13.57 16.22 16.48 17.5 19.17 22.3 22.5 24.6 26.9 Asset Turnover 1.29 1.27 1.28 1.24 1.8 1.8 1.9 1.84 64,826 64,539 60,455 56,910 23,303 22,294 21,102 19,964 50,129 50,781 47,206 46,023 12,695 12,340 11,399 10,855 Fixed Asset Turnover 1.75 1.68 1.7 1.66 2.2 2.2 2.2 2.22 64,826 64,539 60,455 56,910 23,303 22,294 21,102 19,964 37,033 38,428 35,598 34,258 10,794 10,308 9,691 9,002                   Leverage Measures 2013 2012 2011 2010 2013 2012 2011 2010 Long Term Debt Ratio 0.22 0.21 0.22 0.27 0.21 0.21 0.21 0.22 10,827 10,599 10,289 12,520 2,617 2,617 2,339 2,357 50,129 50,781 47,206 46,023 12,695 12,340 11,399 10,855 Long Term Debt to Equity Ratio 0.65 0.6 0.62 0.85 0.46 0.46 0.43 0.47 10,827 10,599 10,289 12,520 2,617 2,617 2,339 2,357 16,661 17,801 16,623 14,681 5,733 5,629 5,424 4,966 Total Debt Ratio 2.01 1.85 1.84 2.13 1.21 1.19 1.1 1.19 33,468 32,980 30,583 31,342 6,961 6,711 5,975 5,889 16,661 17,801 16,623 14,681 5,733 5,629 5,424 4,966 Times Interest Earned 7.76 16.54 11.76 11.01 7.21 8.49 10.13 6.17 2,188 3,985 3,917 3,457 887 874 851 710 282 241 333 314 123 103 84 115                   Profitability Ratios   2012 2011 2010   2012 2011 2010 Operating Profit Margin 3.38% 6.17% 6.48% 6.07% 3.81% 3.92% 4.03% 3.56% 2,188 3,985 3,917 3,457 887 874 851 710 64,826 64,539 60,455 56,910 23,303 22,294 21,102 19,964 Gross Profit Margin 6.31% 8.36% 8.37% 8.10% 5.48% 5.43% 5.50% 5.42% 4,089 5,397 5,060 4,607 1,277 1,211 1,160 1,082 64,826 64,539 60,455 56,910 23,303 22,294 21,102 19,964 Net Profit Margin 0.19% 4.36% 4.42% 4.10% 2.63% 2.68% 3.03% 2.93% 120 2,814 2,671 2,336 614 598 640 585 64,826 64,539 60,455 56,910 23,303 22,294 21,102 19,964 Return on Assets 0.24% 5.54% 5.66% 5.08% 4.84% 4.85% 5.61% 5.39% 120 2,814 2,671 2,336 614 598 640 585 50,129 50,781 47,206 46,023 12,695 12,340 11,399 10,855 Return on Equity 0.24% 5.54% 5.66% 5.08% 4.84% 4.85% 5.61% 5.39% 120 2,814 2,671 2,336 614 598 640 585 50,129 50,781 47,206 46,023 12,695 12,340 11,399 10,855 Return on Capital 0.38% 8.90% 9.06% 7.78% 6.41% 6.50% 7.57% 7.26% 120 2,814 2,671 2,336 614 598 640 585 31,426 31,601 29,475 30,008 9,580 9,204 8,457 8,062 Read More
Cite this document
  • APA
  • MLA
  • CHICAGO
(Introduction to accounting Coursework Example | Topics and Well Written Essays - 2000 words, n.d.)
Introduction to accounting Coursework Example | Topics and Well Written Essays - 2000 words. https://studentshare.org/finance-accounting/1819761-introduction-to-accounting
(Introduction to Accounting Coursework Example | Topics and Well Written Essays - 2000 Words)
Introduction to Accounting Coursework Example | Topics and Well Written Essays - 2000 Words. https://studentshare.org/finance-accounting/1819761-introduction-to-accounting.
“Introduction to Accounting Coursework Example | Topics and Well Written Essays - 2000 Words”. https://studentshare.org/finance-accounting/1819761-introduction-to-accounting.
  • Cited: 0 times

CHECK THESE SAMPLES OF Financial Statement Analysis for Tesco Plc

Introduction to Accounting and Finance

introduction “ABC Energy” is a business project that has been designed keeping the idea of success of Dragon's Den success of Levi Root's Reggae Reggae Sauce.... It has been suggested with believe that any single idea can gain market acceptance and does not require to be an extra ordinary product or extremely different in order to gain the market share....
10 Pages (2500 words) Essay

Introduction to Accounting and Finance

Shiny Gel Hair Product Financial Forecast 1) introduction Assumptions I was playing with different mixing different substances to get my hair shiny look and came up with a formula for a working gel that my friends were amazed at how my hair look.... They wanted to try themselves, too, so I made a few jars for them and since became a supplier of a devoted group of young girls....
5 Pages (1250 words) Essay

Introduction to Accounting - AAS1

Introduction to accounting Introduction to accounting Accruals Accrual basis is one of the fundamental concepts of accounting.... Accrual basis of accounting means that the revenues are recorded when the sales are made or the services are rendered.... Going Concern Concept Going concern is also a key concept accounting that assumes that the company will continue its operation for a foreseeable future.... IAS 16 Property, Plant & Equipments requires that every asset should be depreciated over its useful life, so depreciating every asset is essential in order to meet the requirement of the international accounting standards....
4 Pages (1000 words) Essay

AAS3: Introduction to Accounting

Introduction to accounting - AAS3 Morrisons which was founded by William Morrison as a stall for eggs and butter is the 4th largest super market chain of UK at present.... It is operating in the market that is worth of ?... ... ... ... 5.... billion per year and is likely to double in a decade....
4 Pages (1000 words) Coursework

An introduction to accounting

accounting may not be popular but it is a must for any organisation,be it in the manufacturing or service sector, whatever its size,whichever country it is based in and whether or not its aim is to maximise profits.... Without accounting resources cannot be managed effectively.... It is irrefutable that any business organization requires the use of accounting.... In fact, the use of accounting dates back from the time a business organization is formed....
3 Pages (750 words) Essay

Introduction to Accounting & Finance

The business structure that is more suitable for this business is that of partnership because all the participants are bringing a fair amount of capital to start the business and are going to share.... ... ... (Blurt it n.... .... Their profit sharing ratio can be dependent on the capital that each associate injects. ...
4 Pages (1000 words) Essay

Introduction to Accounting and Finance

According to thehairthread.... om, there was a survey conducted not long ago that came up with the findings that approximately 68% of the population is the only group that is able to give a brief explanation on the.... ... ... Worst still, some of the people interviewed admitted to be applying oily hair products to their hair which was already oily type....
4 Pages (1000 words) Essay

Introduction to Accounting and Finance

This report "Introduction to accounting and Finance" gives an overview of the company's performance in the last financial year.... If the investor lack core accounting knowledge it becomes very difficult for them to understand the Financial Statement and Balance Sheet of a company, hence certain vital financial ratios need must be provided....
6 Pages (1500 words) Report
sponsored ads
We use cookies to create the best experience for you. Keep on browsing if you are OK with that, or find out how to manage cookies.
Contact Us