StudentShare

Our website is a unique platform where students can share their papers in a matter of giving an example of the work to be done. If you find papers
matching your topic, you may use them only as an example of work. This is 100% legal. You may not submit downloaded papers as your own, that is cheating. Also you
should remember, that this work was alredy submitted once by a student who originally wrote it.
✕
Free
Blackberry Inc: Financial Statements Recast, Ratio Analysis, Identifying Red Flags - Assignment Example
Summary
The paper "Blackberry Inc: Financial Statements Recast, Ratio Analysis, Identifying Red Flags" is a great example of a finance and accounting assignment. Red flags in financial statements give an overview of the warning signs investors need to take note of…
- Subject: Finance & Accounting
- Type: Assignment
- Level: High School
- Pages: 5 (1250 words)
- Downloads: 0
- Author: donatokuphal
Extract of sample "Blackberry Inc: Financial Statements Recast, Ratio Analysis, Identifying Red Flags"
College Blackberry Inc Financial ments Recast, Ratio Analysis, Identifying Red Flags Question One Preparing recast income statement and Balance Sheet for 2012 and 2013
Recast Income Statement
30-Nov-13
1-Dec-12
30-Nov-13
1-Dec-12
Sales
1193.00
2727.00
5837.00
8396.00
Cost of sales
(2457.00)
(1897.00)
(6433.00)
(6036.00)
Gross profit
(1264.00)
830.00
(596.00)
2360.00
SG&A
0.00
0.00
0.00
0.00
other operating expenses
(5025.00)
(230.00)
(6626.00)
(1223.00)
Operating Loss
(25.10)
(31.70)
(79.90)
(92.80)
Pre-tax income
(5025.00)
(212.00)
(6627.00)
(1202.00)
Tax expense
(624.00)
(226.00)
(1177.00)
(480.00)
Net Income (Loss)
(4401.00)
14.00
(5450.00)
(722.00)
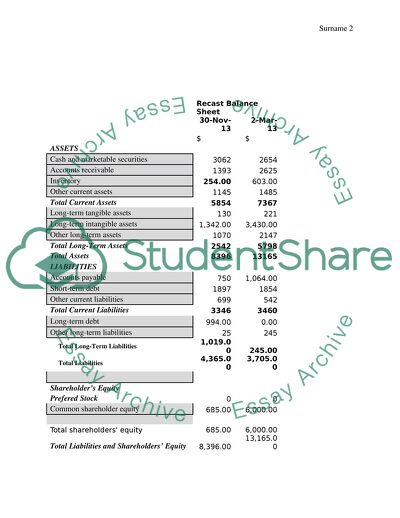
Recast Balance Sheet
30-Nov-13
2-Mar-13
$
$
ASSETS
Cash and marketable securities
3062
2654
Accounts receivable
1393
2625
Inventory
254.00
603.00
Other current assets
1145
1485
Total Current Assets
5854
7367
Long-term tangible assets
130
221
Long-term intangible assets
1,342.00
3,430.00
Other long-term assets
1070
2147
Total Long-Term Assets
2542
5798
Total Assets
8396
13165
LIABILITIES
Accounts payable
750
1,064.00
Short-term debt
1897
1854
Other current liabilities
699
542
Total Current Liabilities
3346
3460
Long-term debt
994.00
0.00
Other long-term liabilities
25
245
Total Long-Term Liabilities
1,019.00
245.00
Total Liabilities
4,365.00
3,705.00
Shareholder’s Equity
Prefered Stock
0
0
Common shareholder equity
685.00
6,000.00
Total shareholders equity
685.00
6,000.00
Total Liabilities and Shareholders’ Equity
8,396.00
13,165.00
Question 2
Identifying financial red flags in the financial statements of Blackberry Inc.
Red flags in financial statements give the overview of the warning signs investors need to take note of. While they might not necessarily be indications of undoubted occurrence of financial statement fraud, they may signal the need for further in-depth research to make assessments on the validity of corporate documents. Creditors on the other hand could use such information to when determining whether to provide loans to companies operating with elevated amount of risk. While evaluating the financial statements of Blackberry Inc. the following red flags were identified:
Recently issued accounting pronouncements
While the new guidance requires that under certain circumstances an unrecognized tax benefit is presented in the financial statements as a reduction to a deferred tax asset as not to a liability. While the new authoritative guidance were supposed to be effective for fiscal years and interim reporting periods beginning after December 15, 2013 but with early adoption and retrospective applications permitted, it is not clear why Blackberry Inc. should adopt the guidance in the first quarter of 2015.
Question 3
Inventory turnover=cost of goods sold/ average inventories
For the nine month ended
2012 2013
=6,036/ 603 =6,433/25
=10.01 times =25.33 times
This refers to the number of times inventory has been converted into sales. The higher the ratio the more active the firm is.
Current ratio= current assets/current liabilities
2012 2013
=7,367/3,448 =5,854/3,337
=2.14 =1.75
It measures the proportion of current liabilities that can be financed by the firms current assets. The higher the ratio then the more liquid the firm is.
Accounts receivable turnover=sales/average accounts receivable
2012 2013
=8,396/2,353 =5,837/1,242
=3.57 =4.7
This is an activity ratio which measures the efficiency with which the firm uses accounts receivables to generate revenue/sales. The higher the ratio the more active the firm has been in generating sales from its debtors.
Days sales in accounts receivable=365 days/accounts receivable turnover
2012 2013
=365/3.57 =365/4.7
=102.24 days =77.66 days
This is a ratio that measures the number of days it takes for debtors to pay up. The lesser the period, the better the firm is as this improves the liquidity position.
Liabilities to assets ratio=total liabilities/total assets
2012 2013
=3,705/13,165 =4,365/8,396
=0.28 =0.52
This is a ratio that measures the proportion of total assets financed by non-owner supplied funds. The higher the ratio, the higher the financial risk.
Liabilities to shareholders equity ratio=total liabilities/total shareholder’s equity
2012 2013
=3,705/9,460 =4,365/4,031
=0.39 =1.08
This ratio measures how much has been financed by the non-owner supplied funds in relation to the amount financed by the owners. The higher the ratio, the higher the financial risk.
Long term debt to shareholders equity ratio=long term debt/total shareholder’s equity
2012 2013
=nil =994/4,031
=0.25
This ratio measures the proportion of the shareholder’s equity financed by non-owner supplied funds. The higher the ratio, the higher the financial risk.
Fixed asset turnover=sales/average fixed assets
2012 2013
=8,396/5,798 =5,837/2,542
=1.45 =2.296
The ratio measures the efficiency with which the firm is using its fixed assets to generate sales. The higher the ratio the more active the firm is.
Assets=liabilities + shareholder’s equity
Cash turnover=sales/average cash and cash equivalents
Current assets turnover=sales/average current assets
Revenues to cash ratio=revenues/average cash balance
Question 4
i. Performance benchmarking
It is used when firms consider their position in relation to the performance characteristics if key products and services
ii. Process benchmarking
It is used when the focus is on improving specific important processes and operations.
iii. Strategic benchmarking
It involves observing how others compete and it also used where firms seek to improve their overall performance.
iv. Financial benchmarking
It involves performing a financial analysis in comparing the results in an effort to assess the overall competitiveness and productivity.
v. International benchmarking
It is used where partners are sort from another company because best practices are located elsewhere in the world.
Question 5
From the ratio analysis carried out in the year 2013 the firm was more active as compared to 2012. Firstly, the firm had a higher inventory turnover in 2013 and this simply means that the firm was more active in converting its inventory into sales.
Secondly, the accounts receivable turnover was higher in 2013 as compared to 2012 implying that it had a higher ability of generating sales from the accounts receivable in this particular year. Also the accounts receivable collection period takes lesser days for debtors to pay up in the year 2013.
Thirdly, the firm is more efficient in using its fixed assets to generate sales in the year 2013 compared to 2012 and this is a good indicator that the firm has improved its efficiency in generating more sales.
Lastly, the gearing ratios which measures the financial risk of a firm shows that in the year 2013 the firm had a higher financial risk since they had a higher ratio as compared to the year 2012.
Based on the information obtained from the analysis it would be profitable to invest in more inventories, accounts receivable and also the fixed assets which indicates that they have a higher ability to generate sales which improves the level of revenues to the firm.
Question 6
With a value of cash and cash equivalents of $2274 at the end of financial period ended November 2013, there is an improvement in the cash and cash equivalents compared to $1910 realized during the previous financial period. This increase could be attributed to the huge increase in the net cash provided by the used in financial activities which offsets the increase in losses the company is experiencing on net cash provided by operating activities. Additionally, it could also be attribute to the decrease in the net cash used in investing activities.
The cash flow position of Blackberry Inc. differs significantly from their income statement. While the income statements reports a net loss of $4401 for the nine months ended November 30, 2013 and a meager net income of only $9 for period ended December 1, 2012, the cash and cash equivalents at the end of November 30 2013 $2274 and $1910 for December 1, 2012. This could be as a result of the various changes faced by the company.
The main source of funds for the company for the 2013 financial period were the net changes in the working capital items, the proceeds on sale of maturity of long term investments, and the proceeds on the sale or maturity of short term investments. The other sources, cash provided by financing activities which were mainly from the issuance of debt.
The income statement is not a fair representation of the ability of blackberry Inc. to generate cash. This is because the income statement fails to present the ability of the firm to generate cash and its adaptability.
Read
More
sponsored ads
Save Your Time for More Important Things
Let us write or edit the assignment on your topic
"Blackberry Inc: Financial Statements Recast, Ratio Analysis, Identifying Red Flags"
with a personal 20% discount.
GRAB THE BEST PAPER
