StudentShare
Contact Us
Sign In / Sign Up for FREE
Search
Go to advanced search...
Free

French Consumer Price Index for All Goods and Services - Assignment Example

Cite this document
Summary
This paper, French Consumer Price Index for All Goods and Services, declares that the inflation in France is based on the change in prices of a standard package of goods and services consumed by the French population. The line graph above shows the increase in inflation every year. …
Download full paper File format: .doc, available for editing
GRAB THE BEST PAPER94.2% of users find it useful
French Consumer Price Index for All Goods and Services
Read Text Preview

Extract of sample "French Consumer Price Index for All Goods and Services"

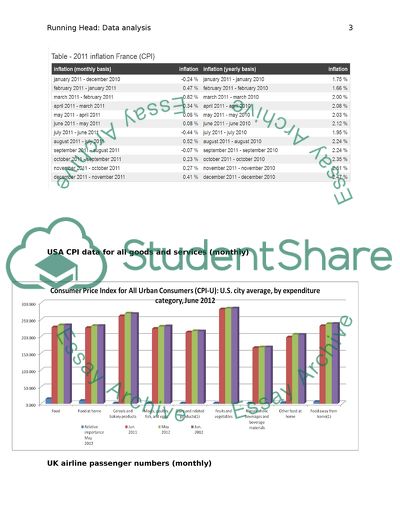
1. French Consumer Price Index (CPI) for all goods and services (monthly), The table above shows the rate of inflation based on the consumer price index (CPI). The inflation in France is based on the change in prices of a standard package of goods and services consumed by French population. The line graph above shows the increase in inflation every year. On monthly basis the inflation was 0.41% in December 2011 as shown in the table below. USA CPI data for all goods and services (monthly) UK airline passenger numbers (monthly) The line graph and column graph above shows the change in UK airline passengers in 2012 from the month of January to June. There is a steady growth in the number of passengers every year although the increase is not rapid. January shows a lower number in the passenger movement while much shows the highest number of passengers in the airline. USA retail sales (monthly) Estimates of Monthly Retail and Food Services Sales by Kind of Business: 2012 Column Graph showing US total retail sales Line graph showing US retail sales for 2012 There is an increase in the total sales from the months of January to march then there is a drop in the months of April and May 2012. This shows that inflation dropped during the month of February and March but during the months of March to May there was an increase in inflation in the retail sales as the sales dropped. Inflation is not good for economy and it does affect all economies. CPI is a measure of inflation in the economy which calls for the central banks and the government to put in place measures to counter it. From the graphs above there is raise of inflation in each sector of deferent countries as illustrated above. Every year inflation increases, at the start of the year in January the countries have lower inflation because people were buying during the festive season all the stores and services provides raises the prices during this period. The effect is felt in the subsequent months hence countering the inflation takes time. Inflation in UK, US and France is similar where by the services or sales at the beginning of the year is good up to march which is the pea. May onwards shows that inflation is high and sales in US retails is going down, the number of Passengers on UK airline drops and the growth is not stable whereby it fluctuates. Question 2 Section 1 (10 marks) 1. a. Nominal String and Ordinal String. Ordinal variables are those variables where the order is important for instance in our data file the question on hardness to learn database management package is ordinal, it has values 1>>>>9 where one indicate easy while 9 indicates hardness. These are ordinal strings which are coded by numbers to represent them Nominal variables on the other hand are categorical variables with no particular order. In our data file for instance, level of education and gender are nominal string which are represented by the numbers but the order does not matter. b. descriptive statistics for three variables. 1. Highest level of education Highest level of education Frequency Percent Valid Percent Cumulative Percent Valid Non-college degree 16 4.3 4.3 4.3 College degree 14 3.8 3.8 8.1 Some post-college work 22 5.9 5.9 14.1 Post-college degree 318 85.9 85.9 100.0 Total 370 100.0 100.0 The above variable shows the level of education of the respondents. Most respondents were post-college degree holder which was 85.9% of the total frequency. There were 5.9% Some post-college work, 4.3% Non-college degree and 3.8% college degree holders. 2. Gender Gender Frequency Percent Valid Percent Cumulative Percent Valid Male 304 82.2 82.2 82.2 Female 66 17.8 17.8 100.0 Total 370 100.0 100.0 Out of 370 respondents 82.2% were male while 17.8% were female. 3. Place of residence Place of residence Frequency Percent Valid Percent Cumulative Percent Valid City 146 39.5 39.5 39.5 Suburb 162 43.8 43.8 83.2 Rural area 62 16.8 16.8 100.0 Total 370 100.0 100.0 The table above shows place of residence of the respondents 43.8% reside in suburb, 39.5% in the city while 16.8% come from the rural area. Section 2 (10 marks) a. Generate bar chart how people ranked the difficulty of learning to use a database management package The bar chart above shows the rating of respondents on the difficulty in learning database management package. Most of the respondent rate 5 which indicate that the package is averagely easy to learn. It can also be notes that most people rated database management package learning as hard compared to those who thought it was not. b. Generate a pie chart showing which database management packages are used most often Dbase II is the most used database management package while most of the respondent indicated that they do not use the software package. Apple works and Lotus 123 had lower respondent who showed that they use them hence they are least popular application used according to the bar chart above. Section 3 a. Produce a histogram showing the current salary The histogram shows the current salary of the respondents there were 370 who participated in the survey the standard deviation was 18.615 while the mean was 42.43. The values are in thousands which means 42.43 is $42,430 salary income for a respondent. The histogram is negatively skewed given that most of the salary income is on the first half of the histogram. The above graph indicates that most respondents earn below 50,000. b. Generate full descriptive statistics for the current salary Descriptive Statistics Salary in '000's N Valid 370 Missing 0 Mean 42.43 Std. Deviation 18.615 Range 150 Minimum 7 Maximum 157 Sum 15698 The statistical table above shows the descriptive statistics. 3 c. The number of people who participated in the survey were 370 the respondent with minimum salary had $7,000 while the highest earner had $157,000. From the respondents the total salary is $156,98000 with an average salary of $42430. The difference between the highest earner and the lowest is range in the descriptive table above ($150,000). From the two results the standard deviation was 18.615 while the mean was 42.43. The values are in thousands which means 42.43 is $42,430 salary income for a respondent. The histogram is negatively skewed given that most of the salary income is on the first half of the histogram. The above graph indicates that most respondents earn below 50,000. Section 4 (60 marks) a. Does whether or not the computer has a hard disc affect the type of computer used? Case Processing Summary Cases Valid Missing Total N Percent N Percent N Percent Brand of computer * Hard disk 370 100.0% 0 0.0% 370 100.0% Chi-Square Tests Value df Asymp. Sig. (2-sided) Pearson Chi-Square 29.855a 5 .000 Likelihood Ratio 32.798 5 .000 N of Valid Cases 370 a. 2 cells (16.7%) have expected count less than 5. The minimum expected count is 3.28. The above statistical tables were as a result of cross-tabulation analysis in SPSS to determine Does whether or not the computer has a hard disc affect the type of computer used. The null hypothesis is that there is no statistical significant difference between the computers used with and those without the hard disc. The chi-square test was included with a 95% confidence level hence 5% significance level. There was no missing value which means all the participants respondents (370) to the two questions. The chi-square test shows a Pearson chi-square sig. (2-sided) as 0.000 where p< 0.000. With the p value we can accept the null hypothesis which states that there is no statistical significant difference between the computers used with and those without the hard disc. This implies that users choose to use computers not because they have hard discs. b. Does gender affect how hard someone finds a word processing package to use? Gender * Rating word-processor Crosstabulation Count Rating word-processor Total 1 2 3 4 5 6 7 8 9 Gender Male 2 8 23 12 38 28 66 50 40 267 Female 1 2 2 2 13 6 12 18 8 64 Total 3 10 25 14 51 34 78 68 48 331 Chi-Square Tests Value df Asymp. Sig. (2-sided) Pearson Chi-Square 7.188a 8 .516 Likelihood Ratio 7.411 8 .493 N of Valid Cases 331 a. 5 cells (27.8%) have expected count less than 5. The minimum expected count is .58. Gender is a variable in our dataset that represent either male or female. The question asks to find out if gender can be a predictor of how fast one can learn word processing package. The first step is to formulate a hypothesis, the null hypothesis will be, there is no statistical difference between the level at which male and female find it hard to learn word processing package. From the statistical table above respondents rated easy to find it to use. The Pearson Chi-Square sig. (2-sided) is 0.516 where p> 0.05, 0.05 is our significance level. Therefore we reject the null hypothesis and accept the alternative which states that, there is statistical difference between the level at which male and female find it hard to learn word processing package. This means that the level at which men and female finds out how to use word processing package differ. b. Does gender affect the hours spent using a microcomputer? Chi-Square Tests Value df Asymp. Sig. (2-sided) Pearson Chi-Square 20.239a 26 .780 Likelihood Ratio 22.483 26 .662 N of Valid Cases 370 a. 36 cells (66.7%) have expected count less than 5. The minimum expected count is .18. The null hypothesis is that there is no statistical significance between the time spent by male and female on using the computer. The Pearson Chi-Square sig(2- sided) is 0.780 where p> 0.05. hence statistically significant. From the chi-square test above we can infer that there is statistical significance in the time spent by male and female using the computer. This can be appreciated from the fact that female respondent many want to take care of other tasks in the house while male are still on the computer. Female are more involved in domestic tasks especially after work compared to male. References Bureau of Labour Statistics 2012, consumer price index, CPI Databases, accessed 9/10/2012 Global-rates, Inflation France Price Consumer Index (CPI), accessed 9/10/2012 Inflation France 2011, accessed 9/10/2012 London City Airport 2012, Monthly Statistics - 1988/2012 Source: 1988-1991 CAA - the flights figures are Air Transport Movements. 1992-2011 London City Airport - the flights figures refer to all flights, accessed 9/10/2012 < http://www.lcacc.org/statistics/lcystat2.pdf> National institute of statistics, may 2012 the consumer prices index, accessed 9/10/2012 Read More
Cite this document
  • APA
  • MLA
  • CHICAGO
(French Consumer Price Index for All Goods and Services Assignment, n.d.)
French Consumer Price Index for All Goods and Services Assignment. Retrieved from https://studentshare.org/finance-accounting/1780069-data-analysis
(French Consumer Price Index for All Goods and Services Assignment)
French Consumer Price Index for All Goods and Services Assignment. https://studentshare.org/finance-accounting/1780069-data-analysis.
“French Consumer Price Index for All Goods and Services Assignment”, n.d. https://studentshare.org/finance-accounting/1780069-data-analysis.
  • Cited: 0 times

CHECK THESE SAMPLES OF French Consumer Price Index for All Goods and Services

Average and Marginal Cost, and Average and Marginal Revenue

In fact, the index does not recover at all in the graph to levels prior to the crisis.... The fall in the index was greatest during the crisis and consequently, recovery from the effects of the recession took the greatest amount of time.... The firm is a price taker and it has to decrease its price to convince its customers to buy additional units of the product....
5 Pages (1250 words) Assignment

Analysis of the attempted merger of AT&T and T- Mobile

The effect was also felt on roaming services by limiting the access of the players on leading edge handsets.... The prices of wireless services fell and reversion to effective duopoly would reverse the gains from wireless competition.... Using Herfindahl-Hirschman index they showed that the approach will contribute to enhance market power....
5 Pages (1250 words) Research Paper

Bank of England Reduces Bank Rate by 0.25 Percentage Points to 5.25%

Interest rates are dependent on prices of goods and services which are changing all the time.... This is because of the difference in goods and services they cover and the method of calculation.... The profitability of the financial services sector, which has been a key driver of UK economic growth in recent years, has also been affected.... The Bank of England, sometimes known as the 'Old Lady' of Threadneedle Street, performs all the function of a central bank including maintaining of monetary stability....
6 Pages (1500 words) Essay

Consumer Spending: How it helps the Economy

Once the is a fall in consumer spending, it means a reduction in the purchasing power of the citizens, less goods and services will be purchased, and as such most companies will cut down on their demands of raw materials, labour and capital.... There is no economy where goods and services are produced for fun, so once consumers spending falls; there is a spiral effect on the economy as a whole.... Transaction costs economics and the new institutional economics have provided ways in which traditional economics model (On the assumptions of maximising behaviour by individuals) can be used in understanding the relationship between institutions and the reform process (… Changes in investment activity, employment, and prices may be a recurring and frequent manifestation of economic development in a competitive and dynamic economy. consumer's spending has profound and often unappreciated impact not only on the lives of the Spending represents a way which cash or liquidity moves from one sector of the economy to the other....
12 Pages (3000 words) Essay

Macroeconomic analysis of France

As per the latest report published by INSEE, the consumer price index (CPI) for all households, which is the measure generally used to determine inflation, was 1% in March 2009, as opposed to 0.... The increase in the consumer price index from 2008 was mainly due to the fact that prices for clothing and footwear increased due to the winter season.... Although their effect was somewhat compensated due to the decrease in prices of communication services, energy and transport services (INSEE, 2009)....
4 Pages (1000 words) Research Paper

Economic Assessment for the US Economy

On the other hand, GDP is defined as the market value of the goods and services attributable to labour and property located in the economy.... It is equal to the total expenditures for all the final goods and services produced within the economy for a given time frame.... %, net exports of goods and services negative 3.... In the United States, the country has grown to be an imported consumer oriented goods and services shown by the negative value of the net exports, which means that the value of imports exceeded the value of exports....
8 Pages (2000 words) Essay

The Importance of Hospital Existence

Therefore all the three hospitals have to have all kinds of emergency services in place to give the people of all three areas a timely service during the crunch time.... all these 3 places are close to the border area near the gulf coast and are prone to various kinds of extreme weather conditions; thunderstorms, hurricanes, tornadoes, and tropical storms.... To analyze the profitability of all the above three hospitals here is a broad sample survey based on two different drugs in each case....
7 Pages (1750 words) Assignment
sponsored ads
We use cookies to create the best experience for you. Keep on browsing if you are OK with that, or find out how to manage cookies.
Contact Us