StudentShare
Contact Us
Sign In / Sign Up for FREE
Search
Go to advanced search...
Free

Financial Analysis and Valuation of Inditex - Assignment Example

Cite this document
Summary
The author of this assignment "Financial Analysis and Valuation of Inditex" examines both companies in comparison to share prices against themselves and the future outlook. It is stated that the Z score analysis for predicting corporate failure was applied. …
Download full paper File format: .doc, available for editing
GRAB THE BEST PAPER91.2% of users find it useful
Financial Analysis and Valuation of Inditex
Read Text Preview

Extract of sample "Financial Analysis and Valuation of Inditex"

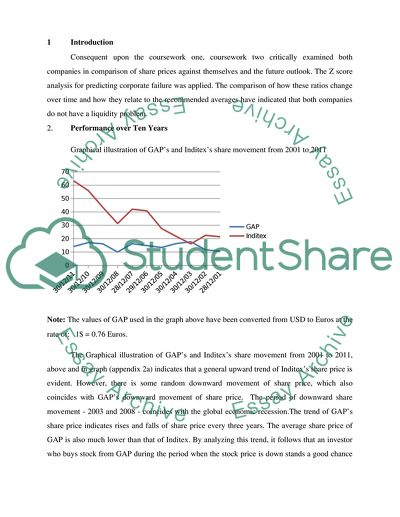
Financial Statement Analysis CONTENTS 1 Introduction…………………………………………………………… 3 2 Performance over ten years…….……………………………………… 3 3 Comparison with the competitor……………………………………… 4 4 Share price trend of the company…………………………………… 5 5 Share price trend of the competitor…………………………………… 6 6 Share price trends for sector…………………………………………… 7 7 Share price trends for FTSE 100 index………………………………… 8 8 Z score analysis……………………………………………………… 8 9 Credit crunch implications…………………………………………… 10 10 Prediction……………………………………………………………… 11 11 References……………………………………………………………….. 13 12 Appendixes………………………………………………………………. 15 1 Introduction Consequent upon the coursework one, coursework two critically examined both companies in comparison of share prices against themselves and the future outlook. The Z score analysis for predicting corporate failure was applied. The comparison of how these ratios change over time and how they relate to the recommended averages have indicated that both companies do not have a liquidity problem. 2. Performance over Ten Years Graphical illustration of GAP’s and Inditex’s share movement from 2001 to 2011 Note: The values of GAP used in the graph above have been converted from USD to Euros at the rate of: 1$ = 0.76 Euros. The Graphical illustration of GAP’s and Inditex’s share movement from 2001 to 2011, above and in graph (appendix 2a) indicates that a general upward trend of Inditex’s share price is evident. However, there is some random downward movement of share price, which also coincides with GAP’s downward movement of share price. The period of downward share movement - 2003 and 2008 - coincides with the global economic recession.The trend of GAP’s share price indicates rises and falls of share price every three years. The average share price of GAP is also much lower than that of Inditex. By analyzing this trend, it follows that an investor who buys stock from GAP during the period when the stock price is down stands a good chance of selling at a higher price within a period of three years. However, the opposite is also true. An investor can buy GAP’s stock when its value its high and end up making a loss if they choose to sell by the end of that three year period.From the share trend it appears safer to invest in Inditex as their stock price is ever growing except in that period of global economic recession. Again, segment of geographical sale in the annual report of the Gap Inc, represented in appendix (1a) and appendix (2c) indicated that the U.S. is the main strength of GAP. However, the sales in the U.S. drop progressively. The markets in Asia and Canada, on the other hand, make steady gains and their rise coincides with the rise of the overall/total sales. The contribution from “other regions” is minimal. The markets in Asia and Canada, therefore, exhibit great potential for growth and GAP should perhaps pay more attention to those regions as the U.S market stagnates. However, the rest of Europe happens to be Inditex’s strongest market. The market in Spain is strong but it has stagnated, while Asia appears to be the next biggest market for potential growth after the “rest of Europe”. The rise in the total sales coincides with the rise in sales of both Asia and the Rest of Europe as can be seen in appendix (1b) and (2b) 3 Comparison with the competitor The orange line represents the share price movement of Inditex whereas the green line represents the share price movement of GAP. It can be observed that during the credit crisis of 2008 the share price of Inditex took a great dip whereas the share price of GAP remains comparatively stable. The share price of GAP remained comparatively higher than the Inditex till 2010 subsequent to which the share price of both the companies comes at par. Review of the recent months shows the share price of Inditex moves upwardly as compared to the GAP which portrays that the company is now performing quite well as compared to its performance in the previous years. 4 Share price trend of the company The share price of the inditex group shows fluctuation over the years. Starting from the end of the financial year 2007, the share price of the company was 38.5402 which gradually kept on decreasing with the financial crisis and liquidity crunch. Financial year 2008 and 2009 are still considered to be the worst ever for the global economy. The most severe effects of the global financial crisis were experienced by the company and financial institution across the globe. Amid the economic crisis, uncertainty prevailed in the fashion and consumer markets and the share prices of these companies. However, the bail out plans by the governments of different nations trying to restore the financial performance, the global financial situation started to return back to its position. The share price of the company also represents the effect of stable financial performance of Spain. The company reached its highest share price by the end of financial year 2011 when it reached 56.185. Since then the share price of the company has been showing mixed trend but the average share price remains quite high and stable. 5 Share price trend of the competitor The historic share price pattern of inditex group, and The GAP \ The analysis reveal the fact that even in time of crisis and liquidity crunch, GAP group was able to outperform its competitors {Inditex} as the share price of the GAP remain relatively higher during that particular period. However, an analysis of the overall situation in the past five years show that subsequent to the financial year 2010, the share price of GAP falls whereas the share price of Inditex Group shows a rising trend. 6 Share price trends for sector Both Inditex and GAP belongs to the consumer retail sector. The above historical market trend of consumer retail sector represents more or less the same pattern as it is displayed by Inditex and GAP. As seen from the graph, the sector, over all, took a huge dip subsequent to the credit crisis of 2008. This factor is displayed in the historical graphical trend of Inditex and GAP. The sector started gaining momentum after the financial year 2010. 7 Share price trends for FTSE 100 index FTSE 100 index comprises of 100 companies listed on the London stock exchange, having the highest market capitalization. One of the techniques used by the investors, before venturing funds into any company, is to compare that particular company’s, or sectors performance to the FTSE 100 index. Comparison between the FTSE 100 index and consumer retail historical market pattern will reveal the fact that both the sectors were hugely impacted by the credit crisis. 8 Z score Analysis The Z-score predicts the future performance or state of a firm. It is regarded as a reasonably reliable predictor of bankruptcy. Z = 1.2 x Working Capital/Total Assets + 1.4 x Retained Earnings/Total Assets + 3.3 x EBIT/Total Assets + 0.6 x Equity at Market Value/Debt + 1.0 x Sales/Total Assets. (Grossman and Livingstone, 2009, pg. 35) Z-score for GAP (2010) Working Capital = Current Assets – Current Liabilities; = 4,664,000 – 2,131,000 = 2,533,000 Total Assets= 7,985,000 Retained earnings = 10,815,000 EBIT/Operating Income = 1,968,000 Sales = 14,664,000 Debt = Current Liabilities + Long-term Liabilities = 2,131,000 + 963,000 = 3,094,000 Equity = 4,891,000 (NB: The financial statements are on appendix 3) Z = 1.2 x 2,533,000/7,985,000 (= 0.38) + 1.4 X 10,815,000/7,985,000 (= 1.896) + 3.3 x 1,968,000/7,985,000 (=0.813) + 0.6 x 4,891,000/3,094,000 (= 0.948) + 1.0 x 14,664,000/7,985,000 (= 1.836) = 5.873 Z-score for Inditex (2010) Working Capital = Current Assets – Current Liabilities; = 3,943,795 – 2,304,960 = 1,638,835 Total Assets= 8,335,437 Retained earnings = 5,288,927 EBIT/Operating Income = 2,290,469 Sales = 12,526,595 Debt = Current Liabilities + Long-term Liabilities = 2,304,960 + 659,931 = 2,964,891 Equity = 5,370,546 (NB: The financial statements are on appendix 3) Z = 1.2 x 1,638,835/8,335,437 (= 0.236) + 1.4 x 5,288,927/8,335,437 (= 0.888) + 3.3 x 2,290,469/8,335,437 (= 0.907) + 0.6 x 5,370,546/2,964,891 (=1.087) + 1.0 x Sales/Total Assets. 1.0 x 12,526,595/8,335,437 (= 1.503) = 4.621 The Z-scores of both GAP and Inditex, at 5.873 and 4.621 respectively, are way above 2.99 and, therefore, predicts solvency for the companies. Although, from the figures, GAP appears to be more secure for the future, financially, both companies are sound investment choices for any investor as the Z-scores predict successful futures for the companies. 9 Credit Crunch Implications The economic crisis that began in 2007 caused retailers to divert their focus in developed markets from expansion to conservation of cash and cost control. Inditex targeted developing markets and, in 2008, opened stores in Egypt, Honduras, Montenegro, and Ukraine. (U.S. International Trade Commission, 2010, pg. 6-10) The economic crisis and, consequently, the economic downturn deeply affected the global retail industry, especially in developed countries. For example, in the U.S. retail sales revenues declined from $4.4 trillion in 2007 to around $4.1 trillion two years later, a decline of close to 7%. In the European Union, retail sales volume fell for five consecutive quarters from the first quarter of 2008. Effects were less pronounced in most developing nations, especially in Asia. Initial estimates indicate that while retail sales fell significantly in several East Central European and former Soviet countries in 2009, such sales rose in China, Brazil and India. (U.S. International Trade Commission, 2010, pg. 6-11) In a similar fashion to this general trend in retail business, the sales of Inditex in the Asian market and other developing countries grew as shown in the graph for sales by geographical segment on appendix (1b) and (2b). However, sales in Spain declined while those in America were close to a standstill. As shown on the table on factories approval on appendix (1d), in response to the global economic crisis, GAP employed a similar strategy to Inditex by approving new factories in emerging markets, with the highest approvals being in South Asia, Southeast Asia and Greater China. From the graph of sales by geographical segment on appendix (1a) and (2c), GAP’s sales in the U.S. fell from 2008 through to 2010, during the global economic crisis period, while sales in Asia rose marginally within the same period. It is, therefore, clear that both GAP’s and Inditex’s response to the global economic crisis and was spreading to new markets in Asia and other developing countries where the effects of the economic crisis were less felt than in Europe and America. 10 Prediction The prediction of future performances by Z-score appears that both companies have bright futures in terms of performance and solvency.Although, the company is exposed to social, politicaland economic risks in all the countries from which it sources its products. The US apparel industry recovered from recessionary declines in 2008 and 2009 with an improved performance in 2010.Historically high prices of traded cotton are a looming threat to future growth in the US apparel industry. Companies are expected to benefit from industry restructuring and growing disposable incomes on the part of the consumer. Strong positive growth in the apparel industry is expected through 2015, with the market returning to pre-recessionary sales figures in 2011. The big story remained the growth of internet retailing of clothes and footwear, with further gains expected over the coming years. The board of directors plan on submitting a proposal during the shareholders annual general meeting for a 12.5% increase in the dividend of the company to a total of 1.80 Euros for every share. Furthermore, Inditex’s net income totaled over 1.9 billion Euros in 2011, a 12% increase from 2010. (Inditex, 2012) GAP, on the other hand, had the March 2012 comparable sales, at $1.46 billion, up by 8% compared with a 10% decline for March 2011 when the sales stood at $1.33 billion. (GAP Inc, 2012). From these latest figures, it is evident that both companies have made good recoveries from the economic crisis period and their sales and earnings are now headed upwards. 11 References Academic Books Alexander, D., Britton A. and Jorissen, A. (2007).International Financial Reporting and Analysis.Third Edition. London: Cengage Learning Pehlivan, C.N. (2011). Financial Analysis and Valuation of Inditex: A business valuation report and theoretical study. GRIN Verlag Rainer, R.K. and Cegielski, C.G. (2010). Introduction to Information Systems: Enabling and transforming business. New York: John Wiley & Sons Pradhan.(2010). Retail Merchandising. New Delhi: Tata McGraw-Hill Education. Hunt, P.A. (2009). Structuring Mergers & Acquisitions: A guide to creating shareholder value. New York: Aspen Publishers Online. Palepu, K.G. and Healy, P.M. (2008).Business Analysis and Valuation: using financial statements. Mason: Cengage Learning. Fisher, M., Fisher, M.L and Raman, A. (2010).The New Science of Retailing: How analytics are transforming the supply chain and improving performance. Boston: Harvard Business Press. Brigham, E.F. and Ehrhardt, M.C. (2010).Financial Management Theory and Practice. Mason: Cengage Learning. Caroll, G.E. (2010). Corporate Reputation and the News Media: Agenda-setting within business news coverage in developed, emerging, and frontier markets. New York: Taylor & Francis. Zaphiris, A. (2006). A Semantic Analysis of Global Corporate Values Statement. New York: ProQuest. Elliot B. and Eliott J. (2001).Financial Accounting and Reporting. Harlow: Financial Times, Prentice Hall. Helfert, E.A. (2001). Financial Analysis: Tools and Techniques: A guide for managers. New York: McGraw-Hill. Bragg, S.M (2006). Financial Analysis: A controller’s guide. New York: John Wiley & Sons. O’Regan, P. (2006). Financial Information Analysis. New York: John Wiley & Sons. Internet Sources Inditex Annual Reports (2008, 2009, and 2010). Retrieved from http://www.inditex.com/en/shareholders_and_investors/investor_relations/annual_reports [Accessed 07 April 2012]. Inditex Group. (2010) inditex group Bloomberg {online} Available at http://www.bloomberg.com/apps/quote? {Accessed 26th March 2012} Journals Altman, E. I. 1968. Financial Ratios, Discriminant Analysis, and the Prediction of Corporate Bankruptcy.Journal ofFinance 23: 589-609 Gepp, A. and K. Kumar. 2008. The Role of Survival Analysis in Financial Distress Prediction. International ResearchJournal of Finance and Economics 16 (2008) 12 Appendixes Appendix 1 (Tables) a) Segment information of GAP Fiscal Year 2008 ($ in millions) Banana % of Net Fiscal Year 2008 Gap Old Navy Repubic Other(3) Total Sales U.S. (1) $3,840 $4,840 $2,221 $ — $10,901 75% Canada 329 392 146 — 867 6 Europe 724 — 23 33 780 6 Asia 732 — 101 47 880 6 Other Regions — — — 68 68 — Total Stores reportable segment 5,625 5,232 2,491 148 13,496 93 Direct reportable segment (2) 333 475 145 77 1,030 7 Total $5,958 $5,707 $2,636 $225 $14,526 100% Sales Growth(Decline) (5)% (14)% (3)% 84% (8)% Source: GAP Annual report 2008 ($ in millions) Banana % of Net Fiscal Year 2009 Gap Old Navy Repubic Other(3) Total Sales U.S. (1) $3,508 $4,949 $2,034 $ — $10,491 74% Canada 312 386 162 — 860 6 Europe 683 — 24 36 743 5 Asia 774 — 106 48 928 7 Other Regions — — — 57 57 — Total Stores reportable segment 5,277 5,335 2,326 141 13,079 92 Direct reportable segment (2) 324 473 134 187 1,118 8 Total $5,601 $5,808 $2,460 $328 $14,197 100% Sales Growth(Decline) (6)% 2% (7)% 46% (2)% Source: GAP Annual report 2009 ($ in millions) Banana % of Net Fiscal Year 2010 Gap Old Navy Repubic Other(3) Total Sales U.S. (1) $3,454 $4,945 $2,084 $ — $10,483 71% Canada 341 427 190 — 958 7 Europe 703 — 36 47 786 5 Asia 872 — 118 59 1,049 7 Other regions — — — 89 89 1 Total Stores reportable segment 5,370 5,372 2,428 195 13,365 91 Direct reportable segment (2) 365 533 155 246 1,299 9 Total $5,735 $5,905 $2,583 $441 $14,664 100% Sales Growth 2% 2% 5% 34% 3% Source: GAP Annual report 2010 GAP’s Sales by Geographical Segment U.S Canada Europe Asia Other Regions Total Stores Reportable Segment Direct Reportable Segment Total 2010 10,483 958 786 1,049 89 13,365 1,299 14,664 2009 10,491 860 743 928 57 13,079 1,118 14,197 2008 10,901 867 780 880 68 13,496 1,030 14,526 Source: GAP Annual report b) Sales by Geographical Segment for Inditex 2010 2009 2008 Spain 3,685,320 3,708,967 3,730,229 Rest of Europe 5,907,091 5,221,491 4,809,263 America 1,440,959 1,096,709 1,038,065 Asia and Rest of the World 1,493,225 1,056,347 829,333 Total 12,526,595 11,083,514 10,406,960 Source: Inditex Annual report c) Stock Analysis Inditex Share price (in Euros) Gap Share Price(in $) 30/12/11 63.28 18.55 30/12/10 56.03 22.46 30/12/09 43.39 21.26 30/12/08 31.33 13.16 28/12/07 42.02 21.36 29/12/06 40.81 19.50 30/12/05 27.55 17.64 30/12/04 21.70 21.47 30/12/03 16.10 23.24 30/12/02 22.51 15.30 28/12/01 21.41 14.01 Source: Inditex and GAP websites d) Approval of factories by GAP in 2007 Region Number of new factories evaluated Approved (%) Not Approved (%) Pending (%) Greater China 96 83.3 16.7 0.0 North Asia 10 100.0 0.0 0.0 Southeast Asia 95 91.6 8.4 0.0 South Asia 99 91.9 8.1 0.0 Persian Gulf 2 100.0 0.0 0.0 North Africa & the Middle East 41 63.4 34.1 2.4 Sub-Saharan Africa 16 68.8 25.0 6.3 Europe 45 80.0 20.0 0.0 United States and Canada 17 94.1 5.9 0.0 Mexico, Central America & the Caribbean 36 97.2 2.8 0.0 South America 4 100.0 0.0 0.0 Total 461 86.3 13.2 0.4 Source: GAP Inc. 2007/2008 Social Responsibility Report: Full Report. pg. 61 Appendix 2 (Graphs) a) Graphical illustration of GAP’s and Inditex’s share movement from 2001 to 2011 b) Sales by Geographical Segment (Inditex) c) Sales by Geographical Segment (GAP) Appendix 3 (financial statements) a) Consolidated Balance Sheet of GAP, Inc ($ and shares in millions except per value) 2010 2009 2008 Assets Current Assets: Cash and Cash Equivalents 2,348 1,715 1,724 Short-term Investments 225 _ 177 Restricted Cash 41 38 Merchandise Inventory 1,477 1,506 1,575 Other current assets 614 743 572 Total current assets 4,644 4,005 4,086 Property, and equipment, net 2,628 2,933 3,267 Other Long Term Assets 693 626 485 Total Assets 7,985 7,564 7,838 LIABILITIES AND STOCKHOLDERS’ EQUITY Current Liabilities: Current maturities of long-term debt 50 138 Accounts Payable 1,027 975 1,006 Accrued expenses and other current liabilities 1,063 1,076 1,259 Income taxes payable 41 57 30 Total Current Liabilities 2,131 2,158 2,433 Long-term Liabilities: Long-term debt _ 50 Lease incentives and other long-term liabilities 963 1,019 1,081 Total Long-Term Liabilities 963 1,019 1,131 Total Stockholders’ equity 4,891 4,387 4,274 Total liabilities and stockholders’ equity 7,985 7,564 7,838 (Source: GAP, Inc Annual reports ) b) Consolidated Balance Sheet for Inditex (In thousands of euros) 2010 2009 2008 Assets Current Assets 3,943,795 3,264, 041 2,981,595 Cash and Cash Equivalents 2,420,110 1,466,291 1,465,835 Trade and other receivables 421,781 585,311 463,716 Inventories 992,570 1,054,840 1,007,213 Income tax receivables 15,663 15,342 1,719 Other current assets 93,671 142,257 43,112 Non-current assets 4,391,642 4,512,605 4,124,007 Property, plant and equipment 3,293,535 3,442,321 3,182,112 Investment property 13,273 8,445 9,475 Rights over leased assets 514,159 531,468 504,604 Other intangible assets 19,118 16,476 13,344 Goodwill 131,685 131,685 125,583 Financial Investments 15,392 14,416 36,174 Deferred tax assets 234,203 203,100 133,020 Other 170,277 164,684 119,695 Total Assets 8,335,437 7,776,646 7,105,602 Liabilities Current Liabilities 2,304,960 2,390,848 2,458,067 Trade and other payables 2,103,029 2,073,141 1,975,251 Financial debt 35,058 234,037 371,276 Income tax payable 166,873 83,670 111,540 Non-current liabilities 659,931 637,190 430,484 Financial debt 4,996 13,241 42,358 Deferred tax liabilities 172,892 213,847 110,957 Provisions 127,054 101,820 47,681 Other non-current liabilities 354,989 308,290 229,488 Equity 5,370,546 4,748,600 4,217,051 Net equity attributable to the parent 5,329,166 4,721,714 4,193,129 Net equity attributable to minority interest 41,380 26,886 23,922 Total Equity and Liabilities 8,335,437 7,776,646 7,105,602 Source: Inditex Annual reports c) Income Statement for Inditex (In thousands of euros) (Notes) 2010 2009 NET SALES (2) 12,626,696 11,085,614 COST OF MERCHADISE (3) (6,104,673) (4,755,606) GROSS MARGIN 7,422,022 6,328,000 OPERATING EXPENSES (4) (4,462,211) (3,952,702) OTHER EXPENSES AND INCOME NET (5) (3,604) (1,118) OPERATING PROFIT (EBITDA) 2,066,207 2,374,180 AMORTIZATION & DEPRECIATION (11.12.13) (676,738) (646,801) OPERATING PROFIT (EBIT) 2,290,585 1,728,388 FINANCIAL RESULTS (6) 31,116 3,782 INCOME BEFORE TAXES 2,321,585 1,732,170 INCOME TAX (22) (580,306) (410,033) NET INCOME 1,741,280 1,322,137 NET INCOME ATTRIBUTED TO NON-CONTROLLING INTEREST 9,461 7,783 NET INCOME ATTRIBUTED TO THE PARENT 1,731,829 1,314,354 EARNINGS PER SHARE EURO CENTS (7) 277.9 211.4 Source: Inditex Annual report 2010, pg.154. Read More
Cite this document
  • APA
  • MLA
  • CHICAGO
(Financial Analysis and Valuation of Inditex Assignment, n.d.)
Financial Analysis and Valuation of Inditex Assignment. Retrieved from https://studentshare.org/finance-accounting/1769532-financial-statement-analysisi
(Financial Analysis and Valuation of Inditex Assignment)
Financial Analysis and Valuation of Inditex Assignment. https://studentshare.org/finance-accounting/1769532-financial-statement-analysisi.
“Financial Analysis and Valuation of Inditex Assignment”, n.d. https://studentshare.org/finance-accounting/1769532-financial-statement-analysisi.
  • Cited: 0 times

CHECK THESE SAMPLES OF Financial Analysis and Valuation of Inditex

Building and mapping a small area deprivation index for health needs assessment

Pg 2 analysis……………………………………………………………….... Carstairs index was chosen by Oliver Morgan and Allan Baker to analyze the situation of growing deprivation because Carstairs index was previously used in ONS studies for analysis....
5 Pages (1250 words) Essay

Topic-Gold stocks and index performance comparison

When there exist jitters on the stability of the economy which will affect the performance of the listed companies in the securities exchange the shares will drop in their valuation.... When the international financial markets are in great upheaval, traders dumb the socks and other financial instruments to save the devaluation of the positions in gold reserves.... Over the recent past, there has been sharp increases I the prices of gold as most of the major financial markets were faltering around the world....
3 Pages (750 words) Research Paper

Financial Management

In the year 2008, the market indices took such drastic plunges that badly damaged the market valuation of listed companies - Dow Jones decreased by 35%, S&P 500 decreased by 39%, and NASDAQ decreased by 42%.... hellip; DIS is engaged in making available products and services that is seen to remain marketable in the coming months despite the general economic slowdown. Attached herewith are a narrative and the supporting tables and graphs that should concisely detail the prevailing market and economic situation, the state of the sector and the industry that DIS belongs to, and the financial condition of DIS and three of its competitors. The data provided herewith were taken from sources of good repute....
3 Pages (750 words) Essay

The Investment, Financing, and Valuation of the Corporation

This paper "The Investment, Financing, and valuation of the Corporation" analyses the propositions on which the share valuation model advocated by Fisher was based and also the newer models that help to mitigate the difficulties faced in Fisher's Model.... In his analysis of valuation of bonds, Fisher has cited several empirical relationships, that has contributed to the formulation of the valuation model evinced by him.... Fisher's contribution to the theory of finance with respect to the valuation of shares is based on the basis of future earnings and the present value of the earnings on the shares....
6 Pages (1500 words) Coursework

Portable Electric Power Tools Industry Development

The main indices used for market analysis are housing starts, expenditures for residential construction, expenditures for commercial construction, and expenditures for home repairs and improvement.... Economic forecasts help companies to evaluate market potentials and set strategic objectives....
4 Pages (1000 words) Essay

Financial Statement Analysis

Financial Reporting, Financial Statement Analysi and valuation: A Strategic Perspective.... The analysis of a company's financial statement reveals the business health and viability.... A debt to equity ratio provides a reliable indicator of Financial ment analysis s), First M.... The analysis of a company's financial statement reveals the business health and viability.... Financial Statement analysis: A Practitioners Guide (4th Edition)....
1 Pages (250 words) Essay

The Financial Statements of Inditex and GAP

The paper "The Financial Statements of inditex and GAP" describes that the financial analysis indicates that GAP was ahead of inditex in terms of revenue generation and profits in the early 2000s, as indicated by the NOPLAT margins, although Inditex later overtook them in the latter part of the decade.... hellip; This report analyses the financial statements of inditex and GAP, Inc and compares the two companies' performances through ratios, vertical and horizontal analysis and the pyramid of ratios....
7 Pages (1750 words) Assignment

Transportation Planning Policy

However, the authors may have indicated the context of this analysis in the title.... The analysis of transport is in the context of an executive approach.... In the literature review, the authors explore transport policy development in the context of financial implications....
8 Pages (2000 words) Annotated Bibliography
sponsored ads
We use cookies to create the best experience for you. Keep on browsing if you are OK with that, or find out how to manage cookies.
Contact Us