StudentShare
Contact Us
Sign In / Sign Up for FREE
Search
Go to advanced search...
Free

Financial Statement and Ratio - Coursework Example

Cite this document
Summary
The researcher of this essay aims to analyze Google Inc.’s Cost of Goods Sold to Net Sales Ratios for 2005, 2006 and 2007. The percentage of the cost of revenues to net sales decreased from almost 42% in 2005 to about 40% in 2006. The decrease was due to lower traffic acquisition costs…
Download full paper File format: .doc, available for editing
GRAB THE BEST PAPER91.8% of users find it useful
Financial Statement and Ratio
Read Text Preview

Extract of sample "Financial Statement and Ratio"

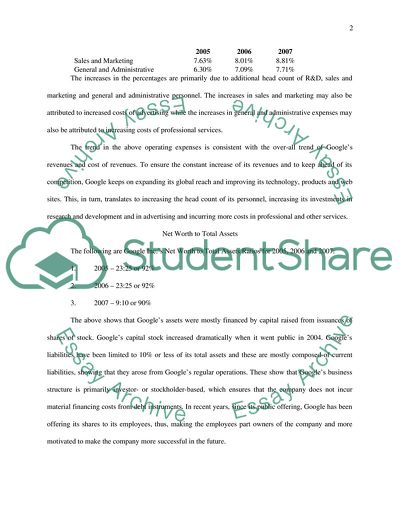
Financial Statement and Ratio Question 1 Cost of Goods Sold to Net Sales The following are Google Inc.’s Cost of Goods Sold to Net Sales Ratios for 2005, 2006 and 2007: 1. 2005 – 21:50 or 42% 2. 2006 – 2:5 or 40% 3. 2007 – 2:5 or 40% The percentage of cost of revenues to net sales decreased from almost 42% in 2005 to about 40% in 2006. The decrease was due to lower traffic acquisition costs as a percentage of total revenues since a bigger part of net revenues was generated from Google’s own web sites compared to the revenues generated from Google Network members’ web sites. From 2006 to 2007, the percentage of cost of revenues to revenues increased slightly from 39.84% in 2006 to 40.07% in 2007 due primarily to the depreciation of Google’s assets and the increased costs of acquiring contents for Google’s own web sites. However, traffic acquisition costs as a percentage of revenues also decreased from 2006 to 2007. The fluctuations in the above ratios are consistent with Google’s development and monetization improvement of its own web sites. This consistency can be seen in the increasing contribution of revenues from Google’s web sites to total revenues. Revenues from Google’s web sites, as percentages of total revenues, have been increasing from 56% in 2005 to 65% in 2007. Since Google has been deriving more revenues from its own web sites, rather than from the Google Network, the increases in total revenues have been more than the increases in traffic acquisition costs. Operating expenses (research and development or R&D, sales and marketing and general and administrative), on the other hand, have been increasing in terms of their percentages to net revenues. The following shows these percentages: 2005 2006 2007 Research and Development 9.8% 11.6% 12.8% 2005 2006 2007 Sales and Marketing 7.63% 8.01% 8.81% General and Administrative 6.30% 7.09% 7.71% The increases in the percentages are primarily due to additional head count of R&D, sales and marketing and general and administrative personnel. The increases in sales and marketing may also be attributed to increased costs of advertising while the increases in general and administrative expenses may also be attributed to increasing costs of professional services. The trend in the above operating expenses is consistent with the over-all trend of Google’s revenues and cost of revenues. To ensure the constant increase of its revenues and to keep ahead of its competition, Google keeps on expanding its global reach and improving its technology, products and web sites. This, in turn, translates to increasing the head count of its personnel, increasing its investments in research and development and in advertising and incurring more costs in professional and other services. Net Worth to Total Assets The following are Google Inc.’s Net Worth to Total Assets Ratios for 2005, 2006 and 2007: 1. 2005 – 23:25 or 92% 2. 2006 – 23:25 or 92% 3. 2007 – 9:10 or 90% The above shows that Google’s assets were mostly financed by capital raised from issuances of shares of stock. Google’s capital stock increased dramatically when it went public in 2004. Google’s liabilities have been limited to 10% or less of its total assets and these are mostly composed of current liabilities, showing that they arose from Google’s regular operations. These show that Google’s business structure is primarily investor- or stockholder-based, which ensures that the company does not incur material financing costs from debt instruments. In recent years, since its public offering, Google has been offering its shares to its employees, thus, making the employees part owners of the company and more motivated to make the company more successful in the future. Based on the annual reports of Google’s competitors such as Yahoo.com, Microsoft Corporation (owner of MSN) and InterActive Corp. (owner of Ask.com), a high percentage of net worth over total assets is common. Although Google has the highest percentages, these companies’ percentages are above 50%, indicating that these companies, and the industry, derive their capital from their equity instruments, rather than debt instruments. Other than the net worth to total assets ratio, there are other information that can be used to analyze these companies. These may include the following: 1. Revenue breakdown by type of revenue and trend analysis of revenues (i.e., percentage changes over the years), which tells us where most of revenues are coming and will tell us what is the focus of the companies in terms of sources of revenues; 2. Revenue breakdown by geography. Due to the type of the industry’s business, the operations of these companies have become global. Information about the geographical sources of revenues will show in which country or area are the companies gaining or losing ground as compared to their competitors. 3. Gross profit rate (sales less cost of goods sold / sales). This will show the mark-up of each company and will also show how efficient the company is in terms of generating sales from each dollar of cost of revenues. 4. Common-size financial statements, particularly percentages of expenses against the revenues, as these will enable the investors or readers to compare the level of operations of each company versus their competitors. It will also show the investors or readers which expense item or items are affected by the sales efforts of the company (i.e., increase in advertising expenses to increase sales). 5. Return on assets (net income / average total assets) as this will tell the readers how efficient the companies are in generating income from utilizing their assets. 6. Net profit on sales (earnings after tax / net sales) which shows the ability of the companies to generate net profit for each dollar of sales. 7. Debt to equity ratio (total liabilities plus preferred shares/ stockholders’ equity) which shows what is the leverage of the company and how protected are the creditors of the company. Issuance of Shares Google issued shares in 2005, 2006 and 2007. In 2005 and 2006, the cash proceeds for issuance of Google’s shares amounted to (in ‘000s) $4,372,255 and $2,384,666, respectively. These proceeds were mostly from public offerings. Proceeds from issued shares in 2007 amounted to about $23.9 million and these came from stock-based award activities of Google. Question 2 Summary – Sum of the Parts By Richard Milne The ongoing financial crisis has caused manufacturers all around the world to be concerned about their supply chains, in general, and in their suppliers, in particular, regardless of the size of these suppliers. The problems faced by the suppliers due to the crisis is a cause for worry among big (and even small) manufacturers as they may find themselves in trouble if one of their suppliers fails to deliver the materials they need to manufacture their products. According to the manufacturers, the problems their suppliers are experiencing are caused by the banks. A German carmakers’ association accused banks of withdrawing credit lines from the suppliers, shortening the payment period and “making credit lines more expensive”. Rating agencies pointed out that the banks had made it more difficult for small and medium-sized companies to secure credit lines from them. The culprit for the suppliers’ problems may also be the manufacturers themselves. Since these manufacturers are big and they have the bargaining power on their side, these companies have succeeded in negotiating payment terms and price cuts that are to their advantage. These approaches, however, may backfire on the big companies since the suppliers no longer have access to the cash they need to operate their businesses. Realizing that they have to do something to protect their supply chains, the big manufacturers have come up with different strategies to protect their businesses and those of their suppliers. These strategies may include early cash payments, lending capital, giving longer orders or even lending workers. Safan, the French aerospace and defense company, have come up with a team called the “crisis cell” to monitor the company’s suppliers and to deal with the problem in a “preventive way”. The same strategy was employed by Volkswagen, Europe’s largest carmaker. To maintain a good supply base, the chief executive of VT Group, a leading British defense group, told the company’s suppliers that they should talk immediately with the company if they encounter financial difficulties. Daimler, the German luxury carmaker, and its rivals are contemplating giving financial assistance to suppliers who are in difficulties. Some manufacturers are looking into the capacity of their suppliers to deliver the supplies. Still others are looking into alternative suppliers who can deliver the goods if the other suppliers fail to do so. Despite the measures undertaken by the manufacturers, there are still doubts whether these are enough in the face of the crisis. One is, even if there’s an alternate supplier, how quickly can this supplier take over the orders of another supplier who have collapsed. Another one is whether there is another supplier who can supply the same material given that the manufacturing process of that material is so complex that there are only a few suppliers who are manufacturing it. Lastly, there are worries on the effect of the inventory level reductions (destocking) that is occurring globally as buyers are waiting for prices to go down before buying and because companies want to have more cash in their balance sheets as the year-end approaches. Although experts believe that the “supply chains are still in good shape”, what is happening to suppliers around the globe is a cause for worry. The global crisis has caused even solid, dependable suppliers to experience difficulties in financing their production. As demand of the consumers go down, the suppliers’ customers start to pay late, to pay less or even to default and these have negative consequences to the suppliers. Such consequences will cause these suppliers to go bankrupt or to stop operations, negatively affecting their customers and creating a vicious cycle, which the big manufacturers are now desperate to prevent at all cost. Information to Assess Health of Suppliers For a manufacturer or a consumer who depends on the existence of the suppliers, it is important to be able to analyze the current health of the supplier as this will determine the supplier’s capacity to deliver current and future orders. The information that can be used to assess the health of the supplier may include: (1) key financial trends such as movements in sales, inventories, payables and receivables and percentages of cost of goods sold to sales, expenses to sales and balance sheet items to total assets and (2) ratio analysis such as current ratio, quick ratio, receivable turnover, inventory turnover, days payables, return on assets, return on sales and return on capital. Other information may include the current economic health of the country or place where the supplier operates, current laws and regulations which may affect the supplier and the current health of the industry of the supplier. Question 3 Three Principal Measures for Customer Perspective One of the perspectives provided in the balanced scorecard is customer perspective, which gives emphasis on customer focus and customer satisfaction. How does a company assess this perspective? What measures can the company undertook to assess whether the company is providing value to its consumers or customers? One measure that can be used is customer loyalty. This measure is important for a company, regardless of whether it is a start-up or a mature company. For a company, the loyalty of its customers means that these customers remain with the company who “treats him well and gives him good value in the long term” (Reichheld, 3). Customer loyalty does not only mean repeat purchases but also the willingness to promote the company to other potential customers. Customers who recommend the company to other people show that they willing to put “their own reputations on the line” (Reichheld, 4) which is an advantage to the company because it will gain more customers at no added cost for marketing and promotions. Thus, according to Reichheld, gaining more customers who promote the company is essential for the growth of the company. A company will be able to see the effectiveness of its business strategies and how well it is able to deliver value to its customers when it sees customer satisfaction rating go up through the increasing number of customer – promoters. Another measure is the acquisition of new customers which can be correlated with the first one. This measure is important for companies that are in a mature industry or for companies that are already in their maturity phase. The ability of the company to gain new customers is an indication that the company is still able to provide value not only to repeat customers but also to new ones. To make this measure more responsive to company analysis, the company may also analyze the demographics of the new customers such as their gender, nationality, age group, income level, etc. as these will enable the company to pinpoint where the new customers are coming from. It will also enable the company to assess why the company is gaining new customers and what it needs to do to retain them and to attract new ones. The third measure is increasing market share. This measure is important because the company is able to assess not only how well it delivered its products to its customers but also how well it delivered its products in comparison with its competitors. It tells the company also if it is targeting its products and services to the right market. The downside of this measure is that, if the company is not able to describe its market properly, it may be targeting the wrong market. The company may keep on trying to increase its share in a market in vain when it is better off refocusing its attention to another market or creating its own niche market. Another downside is, even if it’s targeting the right market, the company may not be able to identify properly the reason why it is gaining or losing market share. If the market values price over quality, then no amount of effort in improving the value added to the products or services will increase the market share. Thus, this measure may not, at all times, provide an assessment on whether or not a company is providing value to its customers. Works Cited Reichheld, Frederick F. The One Number You Need to Grow. Harvard Business Review On Point. December 2003. pp. 2 – 10. 3 December 2008. < http://www.pa-newspaper.org/core/ contentmanager/uploads/Insight/The%20One%20Number%20You%20Need%20To%20Grow.pdf>. Information about Google’s competitors was derived from www.nasdaq.com. Financial ratios were derived from http://www.va-interactive.com/inbusiness/editorial/finance/ibt/ ratio_analysis.html#3. Read More
Cite this document
  • APA
  • MLA
  • CHICAGO
(Financial Statement and Ratio Coursework Example | Topics and Well Written Essays - 2500 words, n.d.)
Financial Statement and Ratio Coursework Example | Topics and Well Written Essays - 2500 words. Retrieved from https://studentshare.org/finance-accounting/1718378-accounting-financial-statement-and-ratio-analysis-assignment
(Financial Statement and Ratio Coursework Example | Topics and Well Written Essays - 2500 Words)
Financial Statement and Ratio Coursework Example | Topics and Well Written Essays - 2500 Words. https://studentshare.org/finance-accounting/1718378-accounting-financial-statement-and-ratio-analysis-assignment.
“Financial Statement and Ratio Coursework Example | Topics and Well Written Essays - 2500 Words”, n.d. https://studentshare.org/finance-accounting/1718378-accounting-financial-statement-and-ratio-analysis-assignment.
  • Cited: 0 times

CHECK THESE SAMPLES OF Financial Statement and Ratio

Financial Ratios. Jardine Cycle and Carriage

Financial ratio Analysis 6 3.... Profitability ratio 6 3.... Liquidity ratio 8 3.... Gearing ratio 9 3.... Investment ratio 11 4.... financial Health of the Company 3 1.... Company financial Background 4 3.... SWOT Analysis from financial Perspective 13 5.... Summary/Workings for financial Ratios 27 1.... financial Health of the Company Jardine Cycle and Carriage Limited is an investment bearing company....
14 Pages (3500 words) Research Paper

Financial Ratios Used in the Financial Statements and Policies

The financial statement prepared with the help of financial ratios is an aid to find out the efficient operation of the business for the share holders, competitors, and outsiders who are willing to invest in the firm.... A financial ratio is defined as “The relationship between two accounting figures expressed mathematically”.... The financial ratio helps to find out the performance of the firm over the years.... The next step after the formulation of such ratios was the development of the body of empirical generalization about such financial ratios which later turn out to be the hypothesis for drawing out a theory of financial ratio analysis....
6 Pages (1500 words) Coursework

Investment and Portfolio Management

This research will begin with the statement that investment refers to the current commitment of dollars for a period of time so as to derive future payments that will compensate the investor for- The period for which the funds have been committedThe expected rate of inflation during this period of timeCompensation for the risk associated with the investment, i.... The objective of the portfolio or the investment policy statement is to achieve long term growth of capital....
33 Pages (8250 words) Assignment

Financial Statement Ratio Analysis

urther, you could even decide your debt-equity ratio - how much share in the profit should be sacrificed for funds and how much should you borrow from the bank.... Without comparing various financial figures (ratios) we cannot make an informed decision.... Imagine a scenario where you decide to start a new business, let's say of manufacturing cookies and selling them in your neighborhood....
14 Pages (3500 words) Essay

Financial Analysis of Flagstar Bank and Bank of America

More specifically, it will consider two banks namely The two main financial statements (the Income statement and Balance Sheet) are going to be analyzed in both cases together with some financial ratios.... It considers their background and further on to the financial reports.... Towards the end it considers their financial ratios as can be lifted from the financial statements to show the… This is a study about financial analysis of banks before and after the global financial crisis that hit the globe starting in year 2008....
5 Pages (1250 words) Assignment

HOMEWORK 7

In other words, return on investment is a profitability ratio.... In other words, return on investment is a profitability ratio.... This ratio is much more influential in the determination of return that investors releases to the company.... The potential to this ratio extends to the determination of investors investment decision point.... Return on assets in relation to cash is another ratio used in the determination of return....
1 Pages (250 words) Personal Statement

Financial Statements, Ratios, The Loan Package

inancial RatiosIn the context of financial reporting, financial ratios are relationship between distinct items of a financial statement.... financial statement analysis: A practitioner's guide.... Financial reporting, financial statement analysis, and evaluation: A strategic perspective.... One commonly used financial ratio is current ratio.... Current ratio is the relationship between current assents and current liabilities in a company's balance sheet (Davies & Lesley, 2014)....
1 Pages (250 words) Essay

Ratio Analysis of Financial Statements

This paper "ratio Analysis of Financial Statements" discusses the system of ratio analysis that has been adopted for purposes of such analysis.... Profit ratio “measures the percentage of each sales dollar remaining after the firm has paid for its goods.... “This ratio indicates how profitable a company is by comparing its net income to its average shareholder's equity.... The higher the ratio percentage, the more efficient management is in utilizing its equity base and better returns to its investors....
9 Pages (2250 words) Case Study
sponsored ads
We use cookies to create the best experience for you. Keep on browsing if you are OK with that, or find out how to manage cookies.
Contact Us