StudentShare
Contact Us
Sign In / Sign Up for FREE
Search
Go to advanced search...
Free

Ratio Analysis and Calculations - Coursework Example

Cite this document
Summary
The paper "Ratio Analysis and Calculations" focuses on the critical analysis of the major issues on ratio analysis and calculations. The profitability of the company is shown by gross profit margin, net profit margin, and Returns on Capital Employed (ROCE)…
Download full paper File format: .doc, available for editing
GRAB THE BEST PAPER92.9% of users find it useful
Ratio Analysis and Calculations
Read Text Preview

Extract of sample "Ratio Analysis and Calculations"

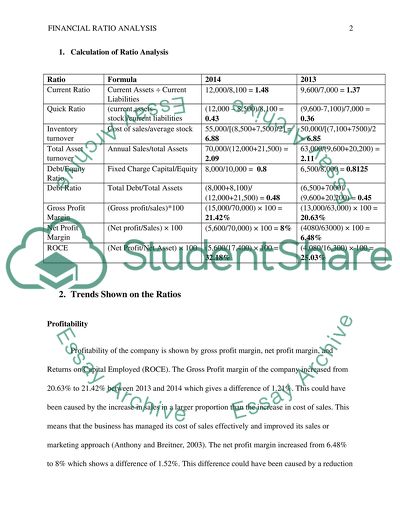
Ratio Analysis Calculation of Ratio Analysis Ratio Formula Current Ratio Current Assets ÷ Current Liabilities 12,000/8,100 = 1.48 9,600/7,000 = 1.37 Quick Ratio (current assets-stock)/current liabilities (12,000 – 8,500)/8,100 = 0.43 (9,600-7,100)/7,000 = 0.36 Inventory turnover Cost of sales/average stock 55,000/[(8,500+7,500)/2] = 6.88 50,000/[(7,100+7500)/2 = 6.85 Total Asset turnover Annual Sales/total Assets 70,000/(12,000+21,500) = 2.09 63,000/(9,600+20,200) = 2.11 Debt/Equity Ratio Fixed Charge Capital/Equity 8,000/10,000 = 0.8 6,500/8,000 = 0.8125 Debt Ratio Total Debt/Total Assets (8,000+8,100)/(12,000+21,500) = 0.48 (6,500+7000)/(9,600+20,200) = 0.45 Gross Profit Margin (Gross profit/sales)*100 (15,000/70,000) × 100 = 21.42% (13,000/63,000) × 100 = 20.63% Net Profit Margin (Net profit/Sales) × 100 (5,600/70,000) × 100 = 8% (4080/63000) × 100 = 6.48% ROCE (Net Profit/Net Asset) × 100 (5,600/17,400) × 100 = 32.18% (4,080/16,300) × 100 = 25.03% 2. Trends Shown on the Ratios Profitability Profitability of the company is shown by gross profit margin, net profit margin, and Returns on Capital Employed (ROCE). The Gross Profit margin of the company increased from 20.63% to 21.42% between 2013 and 2014 which gives a difference of 1.21%. This could have been caused by the increase in sales in a larger proportion than the increase in cost of sales. This means that the business has managed its cost of sales effectively and improved its sales or marketing approach (Anthony and Breitner, 2003). The net profit margin increased from 6.48% to 8% which shows a difference of 1.52%. This difference could have been caused by a reduction in expenses including operating and financing expenses. ROCE also increased from 25.03% to 32.18% which shows a difference of 7.15%. This difference could be due to efficient utilization of assets to produce income and effective asset management. Liquidity Liquidity of the company can be assessed using current ratio and quick ratio. Current ratio measures the number of times that current liabilities can be financed by current assets before they are exhausted (Pollitt, 2001). Quick ratio measures how current liabilities can be measured by more liquid assets before they are exhausted. The current ratio of Youngs increased from 1.37 in 2013 to 1.48 in 2014. This means that the company was able to meet its obligations faster in 2013 than 2013, i.e. it was able to meet its financial obligations easier in 2014 than 2013. The quick ratio of the company also increased from 0.36 in 2013 to 0.43 in 2014. Therefore, the company was more liquid in 2013 than 2014. This liquidity could be due to effective cash management in the company. Efficiency Efficiency of Youngs can be determined by inventory turnover and total asset turnover. The inventory or stock turnover measures the number of times that stock is turned into sales in a year (Fridson & Alvarez, 2002). Total asset turnover measures the amount of sales generated by the sale of a single unit of the total assets. The total asset turnover of Youngs was 2.11 in 2013 and 2.09 in 2014. This means that a single unit of asset was used to generate 2.11 units of sales in 2013 and 2.09 units of sales in 2014. However, the difference between the inventory turnovers in the two years was -0.02 which is a negative figure. It could be because the company acquired more assets and failed to utilize the new assets efficiently to generate more sales. The company also had an inventory turnover of 6.85 in 2013 and 6.88 in 2014. This indicates that the company turned its stock into sales 6.85 times in 2013 and 6.88 times in 2014. The rate of turning stock into sales was faster in 2014 than 2013, although the difference was very small. Gearing The gearing of the company can be analysed using debt ratio and debt to equity ratio. The debt ratio measures the amount of assets that have been financed using total debt – current liabilities and long term debt (Tracy, 2008). On the other hand, debt to equity ratio shows the amount of fixed charge capital that the company uses for every unit of share capital owned by the shareholders. In the case of Youngs, debt ratio increased from 0.45 in 2013 to 0.48 in 2014, showing that the amount of assets financed by debt in the company increased by 0.03 between 2013 and 2014. This could be due to more loans borrowed in 2014. The debt to equity ratio of the company reduced from 0.8125 in 2013 to 0.8 in 2014. This shows that the proportion of equity in the company’s capital structure was higher in 2014 than 2013. This could be because the value of shares issued in 2014 exceeded the amount of loan acquired in the same year. 3. Evaluation of Youngs as an investment In terms of profitability, the gross profit margin and net profit margin increased between 2013 and 2014, indicating that the company is managing and minimizing its cost of sales and expenses effectively. This adds value to investors because higher net profit means that there will be enough retained earnings to distribute to investors in form of dividends (Peterson & Fabozzi, 2012). Potential buyer will also benefit from buying the company because it has positive and increasing profits that can be used by buyers to grow. Return on Capital Employed (ROCE) also increased between the two years, indicating that the company utilized the money of investors effectively by buying assets that generated profits for them. The liquidity of Youngs is also increasing, showing that the company is able to manage its cash and ability to pay debt as it falls due. Buyers can benefit from a company that is highly liquid because they will not face debt problems. Investors are also assured that the company will not be declared bankrupt and liquidated, which usually causes shareholders to lose their investments because creditors are prioritized during liquidation (Brigham and Houston, 2004). Youngs is liquid, and there are low chances of being liquidated, so it is suitable for investors. In terms of efficiency, Youngs had decreasing asset turnover in 2014. In this case, the company’s performance is not good because it does not seem to utilize its assets efficiently to achieve maximum sales. If the company bought more sales in 2014, then it was supposed to produce a proportionately higher sales resulting from the additional assets. Investors require companies to manage assets on their behalf to generate large amounts of sales that can lead to big profits and higher dividends (Kieso et al, 2012). However, the difference between total assets turnover of 2013 and that of 2014 is just 0.02. This is a small figure that cannot impact significantly on the overall performance of the company, although there is need for the company to improve on how it utilizes its assets. Inventory turnover ratio increased, though with a small figure. This means that the company managed stock effectively and turned it into sales faster. This is good for investors who want to invest in the company because it shows that the company can generate value for them through effective stock management. Buyers also benefit by having their stock managed effectively to generate sales for growth. Lastly, the gearing of the company is generally good for investors and buyers. The debt ratio increased between 2013 and 2014, indicating that more debt was used to purchase assets in the company in 2013 than 2014. This does not reflect positively on the performance of the company in terms of asset management. Investors expect the company to use equity capital to purchase assets so that the company does not run into debts that can see their assets liquidated (Ball, 2003). In terms of debt-to-equity ratio, the company also had more equity in 2014 than 2014 in its capital structure. Investors should be happy that debts are reducing compared to equity while investors are happy that the company is managing its capital structure effectively. 4. Effectiveness of Ratio Analysis in Making Financial Decisions Ratio analysis is effective in making financial decisions in some ways, but it also has some limitations which may affect its effectiveness. Ratio analysis is used by investors and buyers to determine the efficiency of asset utilization in a company to generate sales revenue (Fridson & Alvarez, 2011). Users of financial information therefore make decisions based on the efficient utilization of assets by the company. Ratio analysis is also effective in making investing decisions because it determines the ability of the company to meet its financial obligations (Berry, 2011). Stakeholders avoid dealing with companies which may plunge into financial problems. Financial ratio analysis also enables people to make analyse the performance of the company in the industry so that they can make appropriate decision regarding the best performing company to invest in (Haber, 2004). Ratio analysis also enables stakeholders and investors to compare the trend or performance of a company over time so that they can predict if the company can be viable in future before making long-term engagements with the company. Despite these advantages of ratio analysis, its effectiveness may be limited by various issues. First, ratio analysis ignores the size of the company being analysed. This may lead to unreliable information for decision making. It does not also consider the issue of inflation when measuring time series analysis (White et al, 1998). Therefore, the increased financial performance of a company may actually be due to inflation, which leads inaccurate decision making. Furthermore, ratio analysis ignores qualitative or non-quantifiable aspects of a company’s performance, e.g. the impact of corporate image which could be important for decision making (Robinson, 2009). Lastly, ratios are calculated using historical values which ignore fair value. This may be irrelevant for future decision making. References list Anthony, R.N. and Breitner, L.P. 2003. Core concepts of accounting, Prentice Hall, Upper Saddle River, NJ. Ball, I. 2003. “Modern financial management practices”, OECD Journal on Budgeting, Vol. 2, No. 2, pp. 49-76. Berry, L.E. 2011. Financial accounting demystified, McGraw-Hill, New York, NY. Brigham, E.F., & Houston, J.F. 2004. Fundamentals of financial management, Thomson/South- Western, Mason, Ohio. Fridson, M.S., & Alvarez, F. 2002. Financial statement analysis: A practitioners guide, John Wiley & Sons, New York. Fridson, M.S., & Alvarez, F. 2011. Financial statement analysis workbook: Step-by-step exercises and tests to help you master financial statement analysis, Wiley, Hoboken N.J. Haber, J. R. 2004. Accounting demystified, AMACOM, New York. Kieso, D.E., Weygandt, J.J., & Warfield, T.D. 2012. Intermediate accounting, Wiley, Hoboken. Peterson, D.P., & Fabozzi, F.J. 2012. Analysis of Financial Statements, Wiley, New York. Pollitt, C. 2001. “Integrating Financial Management and Performance Management”, OECD Journal on Budgeting, Vol. 1, No. 2, pp. 7-37. Robinson, T.R. (2009). International financial statement analysis, John Wiley & Sons, Hoboken, N.J. Tracy, J.A. 2008. Accounting for dummies, Wiley Pub., Inc, Hoboken, NJ. White, G.I., Sondhi, A.C., & Fried, D. 1998, The analysis and use of financial statements, Wiley, New York. Read More
Cite this document
  • APA
  • MLA
  • CHICAGO
(“Ratio analysis Coursework Example | Topics and Well Written Essays - 1500 words”, n.d.)
Retrieved from https://studentshare.org/finance-accounting/1695072-ratio-analysis
(Ratio Analysis Coursework Example | Topics and Well Written Essays - 1500 Words)
https://studentshare.org/finance-accounting/1695072-ratio-analysis.
“Ratio Analysis Coursework Example | Topics and Well Written Essays - 1500 Words”, n.d. https://studentshare.org/finance-accounting/1695072-ratio-analysis.
  • Cited: 0 times

CHECK THESE SAMPLES OF Ratio Analysis and Calculations

Effect of Capital Structure on the Weighted Average Cost of Capital

It also includes estimation of WACC and different leverages and analysis through leverages and financial ratios are also included in the study.... Deduct the value of the debt to find the shareholders' wealth which we want to maximizeAn investor in a company with a low debt-equity ratio is likely to attach a low probability to that company encountering the severe financial difficulties that we call financial distress....
9 Pages (2250 words) Coursework

Key Factors in a Companys Success

Throughout the analysis in the essay "TESCO company", it is seen that TESCO continues to show itself much more stable than the erratic figures returned for Sainsbury.... Any analysis of this nature must necessarily start from an overall picture of each company's performance to date.... 'analysis doesn't start with ratios – it starts with understanding'....
8 Pages (2000 words) Essay

Overall Financial Assessment of a Nichols Company

The following ratio calculations have helped in reaching an investigative analysis: ... The detailed financial analysis follows: ... Accordingly the profitability analysis have been made from both angles, i.... et profit margin “also called the Return on sales ratio, it shows after tax profit(net income) generated by each sales dollar by measuring the percentage of sales revenue retained by the company after operating expenses, creditor interest expenses, and income taxed have been paid....
6 Pages (1500 words) Essay

Income Balance of Dell Inc

70From these calculations the Return on Equity (ROE) using the DuPont Method will be calculated.... he DuPont analysis is very effective in.... DUPONT analysis FORMULA The formula for calculating ROE using the DuPont Formula is elaborated below CALCULATING RETURN ON EQUITY (ROE) The information extracted from the financials of Dell Inc.... 3%INTERPRETING THE RESULTSThe DuPont analysis is very effective in assessing the performance of the company....
1 Pages (250 words) Essay

RATIO ANALYSIS (FTSE 100)

rom the calculations above, the ROE ratios for TESCO are generally lower than those of Sainsbury.... From the calculations above, TESCO exhibits higher gross profit margins in both years than those of Sainsbury.... The analysis will basically be using the most recent data from the 2013-2014 financial reports of these two s group of ratios basically compares the income statement account of a company to investigate whether a company is able to generate profits in its operation....
5 Pages (1250 words) Essay

Functionality of Transformers Voltage Regulation

It focused on measuring the impedance of the high frequency transformers and demonstrating the characteristics of the voltage (V) by the use of the voltage waveforms.... The experiment.... ... ... The reason behind conducting this practical was to comprehend the use of transformers, principles and how they are applied in our modern world....
5 Pages (1250 words) Essay

Investment Decision and Stock Price Evaluation

a) Whether making investments in the shares of BP is profitable or not, has been analyzed on the basis of the above calculations in respect to the p/e ratio and the share price value calculated using the dividend growth model.... rom the calculations carried out, it has been seen that the p/e ratio of BP in 2013 has been lower than the general industry standards.... The ratio is seen to be as high as 30% (Damodaran, 2012).... The p/e ratio aids investors to understand the market prospects of a given stock....
8 Pages (2000 words) Essay

Managing Finance - Kuwait Finance House and the National Bank of Kuwait

Finally, there will be a reflection that will try to provide feedback on the report and analysis and provide any good thing or bad ones and what can be done about them.... The performance is however measured using a benchmark used to compare the ratios.... The ratios can be used to compare firms within a similar industry as well as a firm....
14 Pages (3500 words) Research Paper
sponsored ads
We use cookies to create the best experience for you. Keep on browsing if you are OK with that, or find out how to manage cookies.
Contact Us