StudentShare
Contact Us
Sign In / Sign Up for FREE
Search
Go to advanced search...
Free

Analysis of Financial Modelling - Assignment Example

Cite this document
Summary
The paper "Analysis of Financial Modelling" states that it is not very realistic to assume that investors consider only the risk while making their investment decisions. There are multiple other factors that are essential, which this model has not considered. …
Download full paper File format: .doc, available for editing
GRAB THE BEST PAPER92.4% of users find it useful
Analysis of Financial Modelling
Read Text Preview

Extract of sample "Analysis of Financial Modelling"

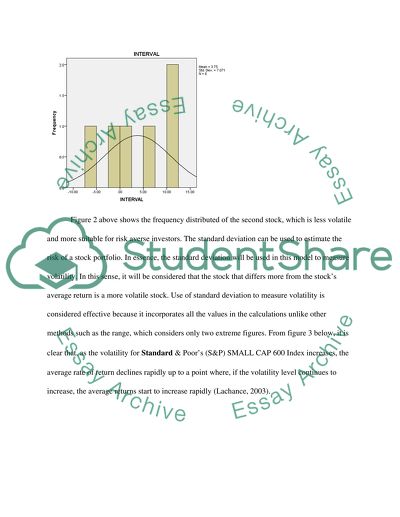
PART ONE Figure1: Standard & Poor’s (S&P) SMALL CAP 600 Index Figure above shows that the portfolio is highly volatile and the returns are almost normally distributed. However, the stock is best suited for a risk taker. Figure 2: New York Stock Exchange (NYSE) World Leaders Index Figure 2 above shows the frequency distributed of the second stock, which is less volatile and more suitable for risk averse investors. The standard deviation can be used to estimate the risk of a stock portfolio. In essence, the standard deviation will be used in this model to measure volatility. In this sense, it will be considered that the stock that differs more from the stock’s average return is a more volatile stock. Use of standard deviation to measure volatility is considered effective because it incorporates all the values in the calculations unlike other methods such as the range, which considers only two extreme figures. From figure 3 below, it is clear that, as the volatility for Standard & Poor’s (S&P) SMALL CAP 600 Index increases, the average rate of return declines rapidly up to a point where, if the volatility level continues to increase, the average returns start to increase rapidly (Lachance, 2003). In effect, when this portfolio is less volatile, its average return tends to decline, but when the rate of volatility is very high, the average returns tend to increase. In situations of high volatility, the risk of a stock tends to be high while on the other hand, when a stock is less volatile, its return is almost assured and hence less risky. The characteristic exhibited by this portfolio is that an investor should expect to make more returns when the stock is highly volatile. As such this stock is suitable for those investors who are comfortable with highly volatile stocks, who invest with the expectation of getting high returns. Considering that I am a risk averse investor, and would prefer stocks with more stable incomes even if it means lower returns - I would not go for this stock (Merton, 1969). Figure3: Standard & Poor’s (S&P) SMALL CAP 600 Index (Annual average vs. standard dev.) From figure 4 below, the pattern of the graph has an implication that higher returns are expected in situations of less volatility. This is precisely the type of portfolio that suits my risk profile because I can invest in conditions of low volatility and still expect some returns albeit low. This also shows that this index performed better, as it is less volatile and hence almost guaranteeing investors some returns. The chance of getting returns from the S&P portfolio is very uncertain and hence considered as having performed poorly on such grounds (Milevsky, 1998). Figure4: New York Stock Exchange (NYSE) World Leaders Index (Annual average vs. standard dev.) Interpretation of the risk and return of the equally-weighted portfolio compared to those of the individual assets. If I invested in equal amount in the above two portfolios, I could have formed a diversified investment, which could have balanced my risk with return. The S & P portfolio is more risky, but attracts higher returns while the New York portfolio is less risky, but attracts less return. One of the most important steps for creating a successful portfolio is efficiently divided assets within scores of different investment types. The performance of these investments depends on the prevailing conditions of the economy. Therefore, a good balance is required to maintain the portfolio strong in different economic situations. Accordingly, the allocation of assets becomes the most important way of diversification. More so, classes of assets carry different amounts of risks. It is important that the investments are spread over a variety of stocks with different risk profiles like the ones analyzed in this paper. This is because each asset class performs differently from the others as a result of its unique balance of risks and rewards. Diversification calls for the need to know the security an investor needs. Therefore, there is a need to spread each asset investment over different types of securities (Little 2012). Rebalancing has proved to contribute to lowering the overall risk in a portfolio. This is only if periodic rebalancing is adhered to so that the portfolio’s asset allocation does not drift out of balance due to changing market conditions. It is, therefore, imperative to shun investments that are not adding quality to life. A prudent investment decision must must always take into consideration important diversification in the area of operation, asset allocation as well as an ideal rebalancing strategy. This ensures an easy to follow investment plan, which is geared towards attaining the investor’s need. The minimization of risks and the maximization of the potential returns is, therefore, imperative when investing (Ferri 2009; Lachance 2003). PART TWO This analysis involves Dow Jones Composite Average which represents the market average on one hand, and American Electric Power Co., Inc. (AEP) and Caterpillar Inc. (CAT) and the individual member portfolios on the other hand. The analysis will involve application of CAPM model and regression analysis to find out the stock’s systematic risk and theoretical return. Systematic risk is the risk that cannot be removed by investing in different companies as a way of diversification. This risk is represented by beta in a CAPM model. The CAPM model assumes that the portfolio is fully diversified and hence the objective of the investors in stocks is systematic risk only. The following is the CAPM formula used to calculate the theoretical return and systematic risk in this paper: E(ri) = Rf + βi(E(rm) - Rf) Rf = risk-free rate of return E(ri) = return required on financial asset i E (rm) = average return on the capital market βi = beta value of financial asset I (which is also the The formula is in the form of y= a+ bx, whereby: Βi = x Rf = Y-intercept E (ri) = SML (plotted on the straight line) (E (rm) = we substitute with 12.82364 which is the weighted average excess returns for the independent variable. The following is the table where these figures are computed. Y Average (y) DJA AEP CAT AEP(EXESS) CAT(EXESS) Average (independent variable) 2001 29.77 43.27 24.66 33.965 13.5 -5.11 4.195 2002 31.66 26.55 24.61 25.58 -5.11 -7.05 -6.08 2003 29.77 28.41 41.33 34.87 -1.36 11.56 5.1 2004 24.43 34.34 46.69 40.515 9.91 22.26 16.085 2005 29.98 37.67 60.45 49.06 7.69 30.47 19.08 2006 33.05 42.04 60.22 51.13 8.99 27.17 18.08 2007 36.99 46.29 68.53 57.41 9.3 31.54 20.42 2008 41.07 34 43.6 38.8 -7.07 2.53 -2.27 2009 42.3 36 60.34 48.17 -6.3 18.04 5.87 2010 35.66 35.62 93.73 64.675 -0.04 58.07 29.015 2011 35.66 40.79 93.66 67.225 5.13 58 31.565 3.149090909 22.498182 12.8236364 The following is the output from SPSS, which is used to run a regression analysis. This will be used to substitute for the above constituent of the formula. Coefficientsa Model Unstandardized Coefficients Standardized Coefficients t Sig. B Std. Error Beta 1 (Constant) 33.935 2.497 13.593 .000 Excess returns .979 .144 .915 6.819 .000 a. Dependent Variable: Ave. returns Therefore: y = 12.82(0.979) + 0.339 Y = 0.979(12.82364) + 0.339 = 12.88% Therefore, an investor will expect to get a return of 12.88%. The beta for this portfolio is quite high and that is why the expected return is also quite high. However, it is important to note that the stock has a beta, which is close to one, meaning that its volatility is very close to that of the market or the benchmark (Kapur & Orszag, 1999). This model will be very useful as it has shown us the relationship between risk and return, and also distinduished between non-diversifiable risk and diversifianble risk. However, the model is not devoid of limitations. For example, it is not very realistic to assume that investors consider only the risk while making their investment decisions. There are a multiple of other factors that are essential, which this model has not considered. Firstly, it is hard to calculate the covariance of returns between assets. Secondly, mathematical method makes it difficult in practice. Third, portfolio model is assumed to be stable. The model was developed from the portfolio choice model introduced by French (2004), which states that an investor selects a portfolio at time t-1, and gets his return at time t. CAPM was constructed on an assumption that investors are risk averse, and the mean and variance (risk and return relationship) of their one-period investment is the key points they give attention to. References Ferri, T 2009, The ETF book: All you need about Exchange trade Funds, Wiley, NewYork. French, R 2004, The Capital Asset Pricing Model: Theory and Evidence. New York: Sage. Kapur, S & Orszag, M 1999, A portfolio approach to investment and annuitization during retirement, Birkbeck College press, London. Lachance, M 2003, Optimal investment behavior as retirement looms, Wharton School, University of Pensylvania, Philadelphia. Little, K 2012, Major Types of Risks for Stock Investors, viewed 30 May 2012, Merton, R 1969, ‘Lifetime portfolio selection under uncertainty: The continuous time case’, Review of Economics and Statistics, vol. 51 no.3, pp.247-257, Milevsky, M 1998, Optimal asset allocation towards the end of the life cycle: to annuitize or not to annuitize?, The Journal of Risk and Insurance, vol 65 no.3, pp.401-426. Milevsky, M 2001, ‘Optimal annuitization policies: analysis of the options’, North American Actuarial Journal, vol. 5 no.1, pp.57-69. Read More
Cite this document
  • APA
  • MLA
  • CHICAGO
(“Introduction to financial modelling Assignment Example | Topics and Well Written Essays - 3500 words”, n.d.)
Retrieved from https://studentshare.org/finance-accounting/1611888-introduction-to-financial-modelling
(Introduction to Financial Modelling Assignment Example | Topics and Well Written Essays - 3500 Words)
https://studentshare.org/finance-accounting/1611888-introduction-to-financial-modelling.
“Introduction to Financial Modelling Assignment Example | Topics and Well Written Essays - 3500 Words”, n.d. https://studentshare.org/finance-accounting/1611888-introduction-to-financial-modelling.
  • Cited: 0 times

CHECK THESE SAMPLES OF Analysis of Financial Modelling

Analysis of Financial Modeling

Introduction: The 'value at risk' is an extensively employed risk measure concept in the risk of loss on a particular portfolio of financial assets.... The aim of the review is to conduct an analysis of the Value at Risk (VaR) of a portfolio of 4 shares using the methods discussed in ASB4416 Financial Modeling.... The review mainly aims to analyze the shares by the various financial models used and by the various analyses of the statistical models....
17 Pages (4250 words) Literature review

The importance of analysis and analytical skills to the manager making decisions in business

The report moves on to address financial modelling and diagrammatic representation approaches.... financial modelling Investopedia (2011) defines financial modelling... From this research it is clear that the importance of analysis and analytical skills to the manager making decisions in a business cannot be refuted....
10 Pages (2500 words) Essay

The Use of Simulation and Modeling Techniques

Business modeling is now widely used in the financial services sector where it is not only being used to develop some strategic level alternatives but also to perform the credit analysis of the counterparties as well as assessing the risks of different decisions.... This paper ''The Use of Simulation and Modeling Techniques'' tells us that given the overall complexity of the business as well as the increasing nature of the competition, it has become more important for businesses to develop techniques that can provide them an opportunity to anticipate scenarios to better prepare themselves....
5 Pages (1250 words) Term Paper

Financial Modelling

Both papers discus different themes and approaches of how to efficiently use spreadsheets to model financial activities. ... eal financial environments are simulated by computer models as to better understand and understand its future.... Read & Batson (1999) summarized that model development should be easy to use, understand, reliable and focused on main issues of the financial scenario.... It also presents its analysis in numerical and graphical formats for ease of comparison and understanding....
4 Pages (1000 words) Book Report/Review

Modelling Operational Risk by AMA

The overall aim of the paper 'modelling Operational Risk by AMA' is to have a more quantitative approach to modeling operational risk whereby it will be able to have a statistical quantification of the level of operational risk losses banks are exposed to.... Even though the Bayesian inference has several strengths and advantages for usage, Shevchenko (2010) lamented that the approach's over-reliance on scenario analysis and expert judgment acts as a major setback for usage within a good number of firms....
5 Pages (1250 words) Essay

Financial Analysis and Modeling

The author of the paper "financial Analysis and Modeling" will begin with the statement that it was required to draw a histogram for the distribution of the Clothing Sales and also to prepare a class interval.... fter that, the histogram was made by using the 'data analysis' technique.... egression analysis ... or the regression analysis, the following variables are considered.... he above-calculated Regression analysis clearly illustrates that the Significance level is within the limit of significance i....
3 Pages (750 words) Essay

Financial Modeling analysis

In order to do this they will need to invest more on stores development within the first financial year as indicated by the 16.... As reflected in the financial forecast account, Lowe's will make increasing sales for the first years, drop the pick-up and maintain a continuous growth of sales till the fifth year....
4 Pages (1000 words) Essay

Financial Analysis, Forecasting, and Modeling

The paper "financial Analysis, Forecasting, and Modeling" is a worthy example of a case study on finance and accounting.... The paper "financial Analysis, Forecasting, and Modeling" is a worthy example of a case study on finance and accounting.... The paper "financial Analysis, Forecasting, and Modeling" is a worthy example of a case study on finance and accounting.... The financial management goal of maximizing the wealth of the shareholder can be achieved through increasing the dividends paid or causing the market value to increase....
11 Pages (2750 words) Case Study
sponsored ads
We use cookies to create the best experience for you. Keep on browsing if you are OK with that, or find out how to manage cookies.
Contact Us