StudentShare
Contact Us
Sign In / Sign Up for FREE
Search
Go to advanced search...
Free

Financial Analysis on Nokia from 2008 to 2009 - Research Paper Example

Cite this document
Summary
 This paper presents an analysis of the financial performance of the Company for the year 2009 as compared with the year 2008. Key financial ratios have been calculated from the published financial statements to assess the relative performance of the Company…
Download full paper File format: .doc, available for editing
GRAB THE BEST PAPER93.6% of users find it useful
Financial Analysis on Nokia from 2008 to 2009
Read Text Preview

Extract of sample "Financial Analysis on Nokia from 2008 to 2009"

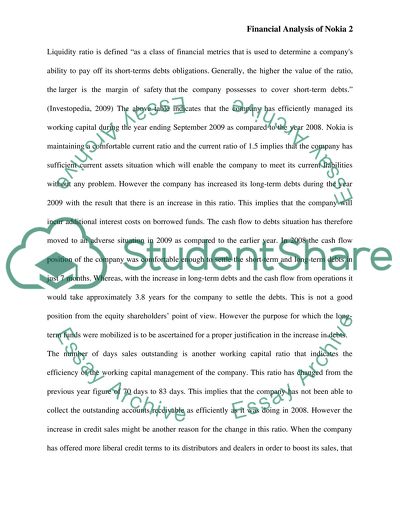
Financial Analysis on Nokia from 2008 to 2009 Nokia is a manufacturer of mobile devices, which makes a range of devices for all major consumer segments and offers Internet services that enable people to experience music, maps, media, messaging and games. This paper presents an analysis of the financial performance of the Company for the year 2009 as compared with the year 2008. Key financial ratios have been calculated from the published financial statements to assess the relative performance of the Company. Working Capital Management of the Company The financial strength of a company can be assessed by studying the way in which the company has managed the various components of its working capital such as accounts receivables, inventory and cash. The Working Capital ratios indicate how well the company is able to manage its working capital. “The asset management ratios are also known as working capital ratios or the efficiency ratios. The aim is to measure how effectively the firm is managing its assets.” (NetTom, n.d.)The following are some of the working capital ratios which indicate the efficiency of the company in managing its working capital. Particulars September 2008 September 2009 Current Ratio 1.1 1.5 Debt to Equity Ratio 1.3% 36.7% Debt to Cash flow from Operations 0.7 3.8 Inventory Turnover (days) 32.2 33.9 No of days sales outstanding 69.7 83.4 Working capital to invested capital 30.2% 71.7% Cash Conversion cycle (days) 34.8 40.6 Source: (SeekingAlpha, 2009) Liquidity ratio is defined “as a class of financial metrics that is used to determine a company's ability to pay off its short-terms debts obligations. Generally, the higher the value of the ratio, the larger is the margin of safety that the company possesses to cover short-term debts.” (Investopedia, 2009) The above table indicates that the company has efficiently managed its working capital during the year ending September 2009 as compared to the year 2008. Nokia is maintaining a comfortable current ratio and the current ratio of 1.5 implies that the company has sufficient current assets situation which will enable the company to meet its current liabilities without any problem. However the company has increased its long-term debts during the year 2009 with the result that there is an increase in this ratio. This implies that the company will incur additional interest costs on borrowed funds. The cash flow to debts situation has therefore moved to an adverse situation in 2009 as compared to the earlier year. In 2008 the cash flow position of the company was comfortable enough to settle the short-term and long-term debts in just 7 months. Whereas, with the increase in long-term debts and the cash flow from operations it would take approximately 3.8 years for the company to settle the debts. This is not a good position from the equity shareholders’ point of view. However the purpose for which the long-term funds were mobilized is to be ascertained for a proper justification in the increase in debts. The number of days sales outstanding is another working capital ratio that indicates the efficiency of the working capital management of the company. This ratio has changed from the previous year figure of 70 days to 83 days. This implies that the company has not been able to collect the outstanding accounts receivable as efficiently as it was doing in 2008. However the increase in credit sales might be another reason for the change in this ratio. When the company has offered more liberal credit terms to its distributors and dealers in order to boost its sales, that situation might have resulted in increased debtors and the consequent increase in the number of days sales outstanding. A weaker sales environment is indicated by the increase in the number of days inventory expressed as a ratio to the cost of goods sold. There is an accumulation of inventory due to lower sales which is indicated by the change in this ratio. Source: (SeekingAlpha, 2009) Growth Potential The company’s growth potential can be assessed by comparing the revenue growth and growth in the operating and net income levels. The key growth indicators are presented in the following table. Particulars September 2008 September 2009 5 year Average Growth in Sales Revenue 14.3% -22.5% 7.8% Assets Turnover ratio 145.2% 110.1% 151.0% Growth in Operating Profit 31.0% -2.4% 4.1% Growth in Cash flow from Operations -9.0% -77.3% 4.7% Growth in Net income -17.6% N/A -2.7% Source: (SeekingAlpha, 2009) A comparison of the growth rates indicates a negative growth for the company during the year 2009 as compared to the last year. The company has performed badly as compared to the 5 year average growth rate in respect of all the factors that are compared. Even though the company has managed its working capital somewhat better, it appears that the company has used long-term funds to meet the short-term and current liabilities which may lead to a liquidity crunch for the company. It is not a good practice to utilize the long-term finances to meet the short-term obligations as this may lead to eventual bankruptcy. Source: (SeekingAlpha, 2009) There is a huge dip in the net Income for the company to the extent of Euro 908 million. This was due to intangible-asset impairment charge on account of Nokia Siemens Networks charged off to revenue during the year 2009. The change in the operating margin clearly indicates a steep decline in the profitability of the company during the year. Only positive observation is that the cash flow of the company has remained positive during the period with a total inflow of Euro 1.7 billion from the operations which will enable the company to sail through the difficult times caused by the general economic downturn. Profitability Ratios “Profitability ratios offer several different measures of the success of the firm at generating profits.” (NetMBA, 2007) The following table present some of the profitability ratios. Particulars September 2008 September 2009 Operating Expenses to Revenue 86.1% 95.7% Return on Invested capital 69.7% 10.5%% Free cash flow to invested capital 69.7% 7.8% Accrual Ratio 2.6% 3.1% Source: (SeekingAlpha, 2009) Source: (SeekingAlpha, 2009) It's clear from the table that Nokia has become much less profitable as Revenue has plunged. Nokia has to keep investing in research and development during cyclical downturns if it wishes to profit during the recovery phase. Because of the increased operating expenses there is a dip in the operating income and the consequently the net income has come down drastically. The price to earnings ratio has gone up from 13.3 as of September 2008 to 104.6 in September 2009 indicating that the stocks of the company are overprices considering the profitability and growth rates during the year 2009. Reference List Investopedia, 2009. Liqudity Ratio. [Online] Available at: http://investopedia.com/terms/l/liquidityratios.asp [Accessed 10 December 2009]. NetMBA, 2007. Financial Ratios. [Online] Available at: http://www.netmba.com/finance/financial/ratios/ [Accessed 10 December 2009]. NetTom, n.d. Session14:Calculation of ratio Analysis. [Online] Available at: [Accessed 10 December 2009]. http://cbdd.wsu.edu/kewlcontent/cdoutput/TOM505/page25.htm SeekingAlpha, 2009. Nokia Financial Gauge Analysis for September 2009 Quarter. [Online] Available at: http://seekingalpha.com/article/167259-nokia-financial-gauge-analysis-for-september-2009-quarter [Accessed 10 December 2009]. Read More
Cite this document
  • APA
  • MLA
  • CHICAGO
(“Financial Analysis on Nokia from 2008 to 2009 Research Paper”, n.d.)
Retrieved from https://studentshare.org/finance-accounting/1531840-financial-analysis-of-nokia
(Financial Analysis on Nokia from 2008 to 2009 Research Paper)
https://studentshare.org/finance-accounting/1531840-financial-analysis-of-nokia.
“Financial Analysis on Nokia from 2008 to 2009 Research Paper”, n.d. https://studentshare.org/finance-accounting/1531840-financial-analysis-of-nokia.
  • Cited: 0 times

CHECK THESE SAMPLES OF Financial Analysis on Nokia from 2008 to 2009

Nokia Managing problems

In this continuous innovative market some huge smart phone manufacturers are competing in the industry including Samsung, nokia, Apple and Google.... hellip; For the last few years nokia have been continuously loosing its market share in different smart phone markets of the world.... nokia is facing a recession phase in some markets as well.... By analyzing this situation it has been observed that nokia is not producing smart phones as good as Samsung and Apple....
11 Pages (2750 words) Essay

Nokia and Motorola

Nokia has a larger global market size than Motorola, in the second quarter of 2008 Nokia had a 40% global market share and this was a 2% increase in market share from the 2nd quarter of 2007.... Motorola on the other had has a 9% market share today which is a decline from the market share in 2007 which was 18%.... Therefore from the market share size it is evident that Motorola is loosing out and Nokia is expanding its market size, it is also clear that Nokia has a larger market share than Motorola and for this reason it is better to invest in the Nokia company due to the growth in the market share of the company which signify an increase in the profit levels in the near future....
7 Pages (1750 words) Case Study

The Power of Branding

This is in direct contrast to Ericsson and Motorola, that not taking quick strides while moving from analog to digital phones, Nokia became leader in the handset market by 1998 itself.... That is, in 1989, Matti Alahuhta, former Member of nokia's Executive Board, developed a marketing strategy for nokia that focused on three key points, that were analyzed in the essay with reference to nokia company, it's brand and products.... The researcher of this essay discusses the topic of branding and uses nokia brand for example....
9 Pages (2250 words) Essay

The Changes in the Economic Environment of Nokia

39B representing a 400% increase from 2008 of 861M.... This study looks at the effects of the changes in the global/regional economic environment of Nokia for the period 2009-2000.... As shown, Nokia has 40% debt leverage in 2009.... This figure is 29% higher than its D/E in 2009, and a significant departure from conservative borrowings from 2000 to 2007.... Its long-term debt in 2009 amounted to 4.... bil for 2009 and 2008....
3 Pages (750 words) Essay

Successful Nokia Product Launch

This present report is about Nokia, which is a Finnish Multinational Communications and Information Technology Company, which in the recent past has experienced a decline of its' market share because of stiff competition within the market especially from rival companies such as Apple and Samsung (Saylor, 2012).... According to the writings by Steinbock (2010), in the past Nokia has taken a back seat in the Smartphone industry mainly due to the intensive competition that comes from other giant such as Apple and Samsung....
8 Pages (2000 words) Essay

Integration of Financial Markets over past 25 years

For the country, smooth consumption is allowed and saves them from potential shocks.... This paper "Integration of financial Markets over past 25 years" is aimed at analyzing the degree of financial integration in various areas of financial markets and tries to study the impact of such financial market integration reflected within the stock market, exchange rates and bond markets.... hellip; financial market integration has been accelerated over the past 20 years for numerous reasons....
8 Pages (2000 words) Essay

Management In Nokia

The essay "Management In nokia" discusses how nokia mobiles are intended to tender a wide variety of business users' elastic access to Oracle Collaboration Suite, via text message, browser, or over-the-air harmonization of the calendar and speak to in rank.... hellip; In 2006, nokia will work to grow initiatives taken in 2005.... The nokia mobiles are intended to tender a wide variety of business users' elastic access to Oracle Collaboration Suite, via text message, browser, or over-the-air harmonization of the calendar and speak to in rank....
8 Pages (2000 words) Essay

Developed Economies Worldwide after the Great Financial Crisis

2009; Chinn and Meredith, 2004).... This risk primarily results from the employment of debt, which is reflected by leverage and leverages multiples.... The financial markets have played an important role in these uncertainties.... hellip; A financial market is referred to as one where private and public companies, as well as individuals, can trade securities and other financial commodities at a price that is determined by changes in economic forces like, demand and supply....
8 Pages (2000 words) Essay
sponsored ads
We use cookies to create the best experience for you. Keep on browsing if you are OK with that, or find out how to manage cookies.
Contact Us