StudentShare
Contact Us
Sign In / Sign Up for FREE
Search
Go to advanced search...
Free

Barnsieydale Sales-Related Data for 2004 and 2005 Report - Research Paper Example

Cite this document
Summary
The paper "Barnsieydale Sales-Related Data for 2004 and 2005 Report" states that sales volumes of office furniture demonstrated the growth of in 2005 comparing to 2004 in all sectors and in all regions. The most capacious sector is Commercial, it takes 52% of the market. …
Download full paper File format: .doc, available for editing
GRAB THE BEST PAPER95.8% of users find it useful
Barnsieydale Sales-Related Data for 2004 and 2005 Report
Read Text Preview

Extract of sample "Barnsieydale Sales-Related Data for 2004 and 2005 Report"

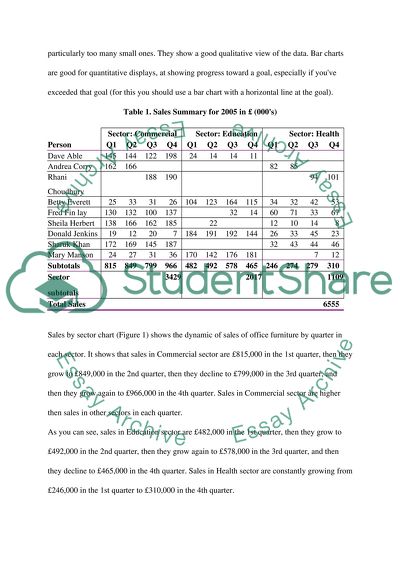
1. Barnsieydale Sales-Related Data for 2004 and 2005 Report The Report is created using Microsoft Excel that is now the World's leading spreadsheet program and is written and distributed by Microsoft Corporation. It features an intuitive interface and capable calculation and graphing tools, so it can be used even by a person without strong computer background. It is overwhelmingly the dominant spreadsheet application available for many platforms and it is part of Microsoft Office, so it can be found in most personal computers. (Wikipedia 2006a) Firstly, subtotals and total amount should be calculated in Sales Summary for 2005 in(000's), as it was done for Sales Summary for 2004 in (000's). There are various ways of adding and counting data (Microsoft Corporation 2006), the most appropriate are simple addition and addition with one or more criteria. Subtotals by quarter for all persons are shown in the Sales Summary for 2005 in(000's) in Table 1. For example, Subtotal 815 means that all salespersons together have sold office furniture on 815,000 in the first quarter in Commercial sector. Then, Sector subtotals (sales volumes by sector) are added. For example, Sector subtotal 3429 means that all salespersons together have sold office furniture on 3,429,000 in Commercial sector in the 2005. Then, 6,555,000 is annual sales result in 2005. Then formatting should be applied to the report to make it easy to read and understand. There are many basic formatting options available at the cell and worksheet level. Most are available on the Format Menu located on the Standard Excel toolbar. (Sandhills Publishing Company 2005) Pie charts and bar charts are very useful for analysis and easy to interpret. Peltier (2006) concludes that pie charts are good when you are showing the relative proportion of numbers that add up to a total, for a single series of data and when there are not too many wedges, particularly too many small ones. They show a good qualitative view of the data. Bar charts are good for quantitative displays, at showing progress toward a goal, especially if you've exceeded that goal (for this you should use a bar chart with a horizontal line at the goal). Table 1. Sales Summary for 2005 in(000's) Sector: Commercial Sector: Education Sector: Health Person Q1 Q2 Q3 Q4 Q1 Q2 Q3 Q4 Q1 Q2 Q3 Q4 Dave Able 145 144 122 198 24 14 14 11 Andrea Corry 162 166 82 85 Rhani Choudhury 188 190 94 101 Betty Everett 25 33 31 26 104 123 164 115 34 32 42 53 Fred Fin lay 130 132 100 137 32 14 60 71 33 67 Sheila Herbert 138 166 162 185 22 12 10 14 8 Donald Jenkins 19 12 20 7 184 191 192 144 26 33 45 23 Sharuk Khan 172 169 145 187 32 43 44 46 Mary Manson 24 27 31 36 170 142 176 181 7 12 Subtotals 815 849 799 966 482 492 578 465 246 274 279 310 Sector subtotals 3429 2017 1109 Total Sales 6555 Sales by sector chart (Figure 1) shows the dynamic of sales of office furniture by quarter in each sector. It shows that sales in Commercial sector are 815,000 in the 1st quarter, then they grow to 849,000 in the 2nd quarter, then they decline to 799,000 in the 3rd quarter, and then they grow again to 966,000 in the 4th quarter. Sales in Commercial sector are higher then sales in other sectors in each quarter. As you can see, sales in Education sector are 482,000 in the 1st quarter, then they grow to 492,000 in the 2nd quarter, then they grow again to 578,000 in the 3rd quarter, and then they decline to 465,000 in the 4th quarter. Sales in Health sector are constantly growing from 246,000 in the 1st quarter to 310,000 in the 4th quarter. Figure 1. Sales by sector Total sales by sector chart (Figure 2) shows the share of sales of office furniture in each sector. It shows that sales in Commercial sector are 52% of all sales, while sales in Education sector are 31% of all sales and sales in Health sector are 17% of all sales. So Commercial sector makes up more than half of the market of office furniture. Figure 2. Total sales by sector Another information, useful for analysis is efficiency of every salesperson's activity, it is shown on Figures 3 and 4. Firstly, here are the data comparing target and real sales volumes and salaries for each salesperson grouped by region: Table 2. Target and real sales volumes and salaries for each salesperson Region Person North South & East West Total Betty Everett Sales 2005 782 782 Target Sales 2005 700 700 Salary 2005 28 28 Dave Able Sales 2005 672 672 Target Sales 2005 850 850 Salary 2005 30 30 Donald Jenkins Sales 2005 896 896 Target Sales 2005 950 950 Salary 2005 42 42 Fred Finlay Sales 2005 776 776 Target Sales 2005 700 700 Salary 2005 32 32 Mary Manson Sales 2005 806 806 Target Sales 2005 850 850 Salary 2005 30 30 Rhani Choudhury Sales 2005 573 573 Target Sales 2005 450 450 Salary 2005 27 27 Sharuk Khan Sales 2005 838 838 Target Sales 2005 850 850 Salary 2005 29 29 Sheila Herbert Sales 2005 717 717 Target Sales 2005 950 950 Salary 2005 38 38 Total Sales 2005 2316 2186 1558 6060 Total Target Sales 2005 2550 2350 1400 6300 Total Salary 2005 89 107 60 256 From this pivot table you can see that real sales in 2005 are only 6,060,000 while target sales in 2005 are 6,300,000. 256,000 is spent on the salaries in 2005. It is interesting, that sales activity in North region is the most profitable: while only 89,000 is spent on the salaries, while sales are 2,316,000. Target and real sales by person bar chart (Figure 3) shows that Rhani Choudhury, Betty Everett and Fred Finlay exceeded the expectations, while the others demonstrated real sales lower then target sales. It could be a reason to raise their salaries. Figure 3. Target and real sales by person Figure 4. Total sales by person A total sales by person pie chart (Figure 4) shows the share of sales of office furniture of each person. It shows that the most successful salesperson is Donald Jenkins (13.7% of all sales); the least one is Andrea Corry (7.6% of all sales). A total sale by region chart (Figure 5) shows the share of sales of office furniture in each region. It shows that sales in North region are 38% of all sales, while sales in South and East region are 36% of all sales and sales in Health region are 26% of all sales. So North region makes up slightly most share of the market of office furniture. Figure 5. Total sales by region The last chart Comparison of sales in 2004-2005 (Figure 6) shows that each salesperson except for Donald Jenkins demonstrated growth of sales volume in 2005 comparing to 2004. But it is Donald Jenkins who have the greatest sales volume in 2004 and in 2005. Sheila Herbert has the least sales volume in 2004 and in 2005. Figure 6. Comparison of sales in 2004-2005 As a conclusion, it can be summarized that sales volumes of office furniture demonstrated growth of in 2005 comparing to 2004 in all sectors and in all regions. The most capacious sector is Commercial, it takes 52% of the market. The most capacious region is North, it takes 38% of the market. Total sales in 2005 are 6,555,000. Among salespersons, Donald Jenkins demonstrated the greatest sales volume 896,000. Rhani Choudhury, Betty Everett and Fred Finlay demonstrated real sales greater then target sales in 2005. 2. Improvements to the Current System The current system is designed in Microsoft Excel and is created mostly manually. It is an unreliable way of data handling, also it provide few opportunities for automation. Also, this way does not allow tracking sales information during a number of years. I suggest creating new Information System for Barnsleydale using Microsoft Access. According to Wikipedia (2006b), Microsoft Access is a relational database management system from Microsoft, which combines the relational Microsoft Jet Database Engine with a graphical user interface. It can use data stored in Access/Jet, SQL Server, Oracle, or any ODBC-compliant data container. Skilled software developers and data architects use it to develop powerful, complex application software. Relatively unskilled programmers can use it to build simple applications without having to deal with features they don't understand. It supports substantial object-oriented (OO) techniques. I suggest following objects, or tables for the database: Salesperson information Sales details Region Sector Customer Figure 7 shows relationships between tables. One salesperson cans sale office furniture to many customers and in many sectors, but in one region. Every customer belongs to one region and to one sector. Figure 7. Relationships between database tables One of the benefits of Access from a programmer's perspective is its relative compatibility with SQL - queries may be viewed and edited as SQL statements, and SQL statements can be used directly in Macros and VBA Modules to manipulate Access tables. Users may mix and use both VBA and "Macros" for programming forms and logic and offers object-oriented possibilities. The report writer in Access, while capable and up to the task of sophisticated report creation is not as full-featured and powerful but it can completely meet Barnsleydale's needs. Access' cut and paste functionality can make it a useful tool for connecting between other databases (for example, Oracle and Microsoft SQL Server during data or database conversions). Access comes with various import and export features that allow integration with Windows and other platform applications, several of which can be executed on demand from within applications or manually by the user. All data about sales will be entered in Microsoft Access database using forms. I suggest following electronic forms: Enter new Salesperson information Enter new Sales details Enter new Region Enter new Sector Enter new Customer So functionality will be expanded in case of entering European market or hiring new salesperson. Also, if a customer is added once to the database, this information will be used later for other sales to this customer. Also, more information can be stored and tracked in Microsoft Access then in Microsoft Excel. For example, with new Information System personal information about salespersons, such as address, telephone, passport details, date of birth and photo will be stored in database. So this information can be used for purposes other then reporting, for example booking tickets or congratulation with birthday. Microsoft Access provides wide opportunities for reporting. I suggest following reports: Sales Summary for a year Sales by salesperson Sales by quarter Sales by region Sales by sector Sales for all period Comparison of real sales and target sales Profit for a year Salaries of salespersons Other reports including grouping and sorting, can be added later. Also, other functionality can be added to the Information System later, such as web access of salespersons to it. References Duffy, T 2000, Microsoft Access 2000. Microsoft Certified Edition. Prentice-Hall. ISBN 0-201-45916-7. Frye, C 2001. Microsoft Access Version 2002 Plain and Simple. Microsoft Press. ISBN 0-7356-1454-7. Hahn PR and Giddeon K 1999, How to use Microsoft Access 2000. Sams Publishing. ISBN 0-672-31589-0. Microsoft Corporation 2006, Microsoft Excel, Microsoft Corporation, viewed 22 April, 2006, Peltier J 2006, Pie Charts in Microsoft Excel, MouseTrax Computing Solutions, viewed 22 April, 2006, Prague, CN and Michael RI 1999, Microsoft Access 2000 Bible. Hungry Minds. ISBN 0-7645-3286-3. Sandhills Publishing Company 2005, Microsoft Excel: Basic Worksheet Formatting, Sandhills Publishing Company, viewed 22 April, 2006, Wempen, F 1999, Teach Yourself Microsoft Access 2000 in 10 Minutes. Sams Publishing. ISBN 0-672-31487-8. Wikipedia 2006a, Microsoft Excel, Wikipedia, viewed 22 April, 2006, Wikipedia 2006b, Microsoft Access, Wikipedia, viewed 22 April, 2006, Read More
Cite this document
  • APA
  • MLA
  • CHICAGO
(“Barnsieydale Sales-Related Data for 2004 and 2005 Report Research Paper”, n.d.)
Barnsieydale Sales-Related Data for 2004 and 2005 Report Research Paper. Retrieved from https://studentshare.org/finance-accounting/1521893-information-systems-essay
(Barnsieydale Sales-Related Data for 2004 and 2005 Report Research Paper)
Barnsieydale Sales-Related Data for 2004 and 2005 Report Research Paper. https://studentshare.org/finance-accounting/1521893-information-systems-essay.
“Barnsieydale Sales-Related Data for 2004 and 2005 Report Research Paper”, n.d. https://studentshare.org/finance-accounting/1521893-information-systems-essay.
  • Cited: 0 times

CHECK THESE SAMPLES OF Barnsieydale Sales-Related Data for 2004 and 2005 Report

From Counterculture to Cyberculture: the Rise of Digital Utopianism

The definition of the computer used today is based primarily on von Neumann's conception that the computer is a device, which is capable of accepting data input, processing data, storing it, and producing data output.... This report "From Counterculture to Cyberculture: the Rise of Digital Utopianism" presents a succinct description of the history of computing by describing major inventions in computing....
7 Pages (1750 words) Report

Benefits for a Business to Upgrade to Windows Server 2003

However, this latest operating system contains over 340 (Eurodata, 2004) improvements for Windows 2000 Server and the capability to handle different server functions that can significantly increase productivity and security that will give businesses added benefits.... This is exactly what Microsoft wants to sell; a fast, reliable, and secured platform with advanced connectivity that can provide a company greater competitive advantage in the global marketplace (Eurodata, 2004)....
8 Pages (2000 words) Report

Data Protection Act 1998 and Freedom of Information Act 2000

Further, if distress is caused, that can be claimed if he also suffers damage by reason of the contravention or the contravention is in respect of the processing of personal data for special purposes.... The paper "data Protection Act 1998 and Freedom of Information Act 2000" evaluates a few points on both acts and discusses the aforementioned acts.... nbsp;Under the data Protection Act 1998, the data has to be processed in accordance with the law and in a manner that is fair and proper....
5 Pages (1250 words) Report

Using and Validating the Strategic Alignment Model

This report "Using and Validating the Strategic Alignment Model" presents an information technology (IT) system with the overall business strategies.... The ineffectiveness of the IT department to align IT systems with business strategies is often associated with the failure of an IT project.... hellip; In the contemporary business environment, organizations are faced with numerous challenges that have increased the risk exposure of these organizations....
7 Pages (1750 words) Report

2008 Presidential Campaign

This report "2008 Presidential Campaign" discusses America that goes to the polls in the year 2008.... The Bush Regime has till now, controlled the government, the military, and the judiciary, each one adding up to form the essence of democracy in its own right.... hellip; The fact that America has a bad reputation in the league of nations is something that we will work upon....
5 Pages (1250 words) Report

The Oppression of Women

Possibly, the most compelling, and perhaps disapproving data of all to propose that gender has an impact comes from a study in 2008, in which Kristen Schilt, a University of Chicago sociologist and New York University economics scholar Matthew Wiswall studied the wage lines of people who undertook a sex change....
6 Pages (1500 words) Report

Equality Issues: Men's Rights Groups

The first of the true mens rights movements was the Coalition of American Divorce Reform Elements of 1971, from which the Mens Rights Association would later emerge 2 years later (Newton, 2004).... This report "Equality Issues: Men's Rights Groups" discusses the claims of feminists with respect to society's bias against women that are suspect....
8 Pages (2000 words) Report

Inflammation as a Cardiovascular Risk Factor

The paper "Inflammation as a Cardiovascular Risk Factor" discusses a relationship between the markers of inflammation and cardiovascular disease.... The paper highlights the idea of inflammation, the impact on the body, test for the assessment , a risk in a gradation on the changes that are measured....
9 Pages (2250 words) Report
sponsored ads
We use cookies to create the best experience for you. Keep on browsing if you are OK with that, or find out how to manage cookies.
Contact Us