StudentShare
Contact Us
Sign In / Sign Up for FREE
Search
Go to advanced search...
Free

Garmin Analysis - Looking to the Future - Research Paper Example

Cite this document
Summary
From the paper "Garmin Analysis - Looking to the Future" it is clear that the company will obtain additional borrowing of $1bn which will have an impact on the capital structure of the company. The interests of shareholders will be diluted as creditors will have to be paid before shareholders. …
Download full paper File format: .doc, available for editing
GRAB THE BEST PAPER91.1% of users find it useful
Garmin Analysis - Looking to the Future
Read Text Preview

Extract of sample "Garmin Analysis - Looking to the Future"

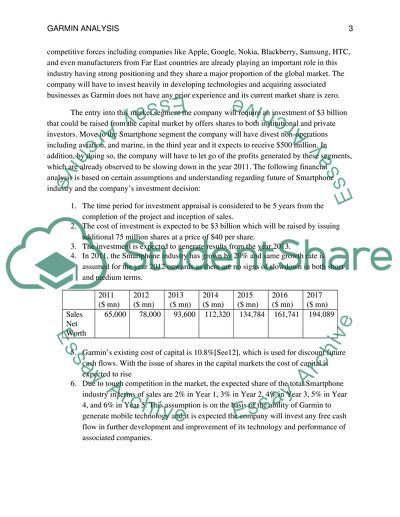
? Garmin Analysis – Looking to the Future Garmin Analysis – Looking to the Future Background Garmin, Inc. is a US based company that is involved in three main industries that are auto/mobile, marine, aviation industry and outdoor/ fitness industry. The company’s current position in its existing markets is threatened by the strong competition and the company’s position is worsening particularly related to its automotive business segment. As the company’s CEO, it is time to make certain strategic and financial decisions which could help the company to revive its position to regain its position in the market and generate healthy returns from its businesses. In order to go forward in the future, there are three scenarios under consideration, which are related to different possible course of strategic actions that the company may follow to address its problems. In this report, these strategic options are evaluated on the basis of various financial models and descriptive analysis of the company’s existing position and outcome of these decisions. Before the analysis is carried out, it would be useful to provide a summary table of the performance of five identified business segments of the company in the last three years. Business Segments 2011 Net Sales % Change in Sales 2011 EBIT % Change in EBIT 2010 Net Sales % Change in Sales 2010 EBIT % Change in EBIT 2009 Net Sales 2009 EBIT Outdoor 363,223 13.82 171,245 13.43 319,119 6.62 150,973 2.01 299,300 147,996 Fitness 298,163 23.99 107,881 24.72 240,473 41.77 86,499 49.02 169,624 58,046 Marine 221,730 11.50 60,092 -3.75 198,860 11.94 62,431 8.71 177,644 57,430 Automobile/Mobile 1,590,598 -4.69 171,717 -16.60 1,668,939 -18.75 205,887 -57.86 2,054,127 488,584 Aviation 284,855 8.51 73,226 2.44 262,520 6.83 71,482 26.30 245,745 56,595 The table provided above provides trends in net sales and EBIT of all business segments, which would be referred to in the discussion related to the scenarios presented below. Scenario #1: Assault on the Smartphone Market Under this future scenario, the company may aim to target the Smartphone market which is worth $65 billion and it has been growing at a fast pace of 20% every year. The smart phone market is dynamic as new markets are emerging such as Africa and Asia. However, the competitive forces including companies like Apple, Google, Nokia, Blackberry, Samsung, HTC, and even manufacturers from Far East countries are already playing an important role in this industry having strong positioning and they share a major proportion of the global market. The company will have to invest heavily in developing technologies and acquiring associated businesses as Garmin does not have any prior experience and its current market share is zero. The entry into this market segment the company will require an investment of $3 billion that could be raised from the capital market by offers shares to both institutional and private investors. Move to the Smartphone segment the company will have divest non-operations including aviation, and marine, in the third year and it expects to receive $500 million. In addition, by doing so, the company will have to let go of the profits generated by these segments, which are already observed to be slowing down in the year 2011. The following financial analysis is based on certain assumptions and understanding regarding future of Smartphone industry and the company’s investment decision: 1. The time period for investment appraisal is considered to be 5 years from the completion of the project and inception of sales. 2. The cost of investment is expected to be $3 billion which will be raised by issuing additional 75 million shares at a price of $40 per share. 3. The investment is expected to generate results from the year 2013. 4. In 2011, the Smartphone industry has grown by 20% and same growth rate is assumed for the year 2012 onwards as there are no signs of slowdown in both short and medium terms. 2011 ($ mn) 2012 ($ mn) 2013 ($ mn) 2014 ($ mn) 2015 ($ mn) 2016 ($ mn) 2017 ($ mn) Sales Net Worth 65,000 78,000 93,600 112,320 134,784 161,741 194,089 5. Garmin’s existing cost of capital is 10.8% (Seeking Aplha, 2012), which is used for discount future cash flows. With the issue of shares in the capital markets the cost of capital is expected to rise 6. Due to tough competition in the market, the expected share of the total Smartphone industry in terms of sales are 2% in Year 1, 3% in Year 2, 4% in Year 3, 5% in Year 4, and 6% in Year 5. This assumption is on the basis of the ability of Garmin to generate mobile technology and it is expected the company will invest any free cash flow in further development and improvement of its technology and performance of associated companies.   2013 ($ mn) 2014 ($ mn) 2015 ($ mn) 2016 ($ mn) 2017 ($ mn) Expected Share of Market 2% 3% 4% 5% 6% Expected Sales 1,872 3,370 5,391 8,087 11,645 7. Based on the historical performance of the company, it is expected that the company will be able to generate net income after tax of 20% from the new business as well.   2013 ($ mn) 2014 ($ mn) 2015 ($ mn) 2016 ($ mn) 2017 ($ mn) Expected Profit 374 674 1,078 1,617 2,329 Receipts from Sale of Non-Core Assets 500 Expected Cash Flow 374 674 1,578 1,617 2,329 Net Present Value (NPV) = -3,000 + 374/(1.108) + 674/(1.108)^2 + 1,578/(1.108)^3 + 1,617/(1.108)^4 + 2,329/(1.108)^5 = $1,514 mn Internal Rate of Return (IRR) = 24.56% Average Return on Invested Capital (ROIC) = For ROIC, cash to be generated from the businesses decisions are used. It is therefore also referred to as Cash ROIC (Brigham & Houston, 2009). 2013 2014 2015 2016 2017 ROIC 12.5% 22.5% 52.6% 53.9% 77.6% Average ROIC 43.8% Return on Equity: Previous Total Shareholders’ Equity: $3,256,581 (2011) Additional Capital + Paid In Capital: $3,000,000 (Issue of New Shares) Total Equity: $6,256.581 bn   2013 2014 2015 2016 2017 ROE 6.0% 10.8% 25.2% 25.9% 37.2% Average ROE 21.0% Scenario #2: The Niche Operator In the second scenario, the company can focus on its value added business segments including outdoor, fitness, aviation, and marine. Since, the company has strong position in these markets therefore expectation of growth over the average growth rates recorded in Earnings before Tax has been assumed. The automobile segment will deteriorate and will be disposed of in the third year generating $1.5bn. The following financials are prepared on the basis of certain assumptions: 1. The time period for evaluation is considered to be 3 years. 2. Since no new investment is required for this option therefore the NPV will be based on the company’s current capital invested and present value of future cash flows expected from the business segments 3. The growth rates for each business segment is provided in the following table: Business Segments 2012 2013 2014 Outdoor 15% 15% 15% Fitness 40% 40% 40% Marine 10% 10% 10% Automobile/Mobile 0% 0% 0% Aviation 25% 25% 25% 4. The expected cash flows from all business segments including the expected cash flow from disposal of the automobile division in the third year are provided as follows:     Expected Cash Flow Business Segments 2011 EBT 2,012 2013 2014 Outdoor 171,245 196,932 226,472 260,442 Fitness 107,881 151,033 211,447 296,025 Marine 60,092 66,101 72,711 79,982 Automobile/Mobile 171,717 171,717 171,717 15,000,000 Aviation 73,226 91,533 114,416 143,020 Total 584,161 677,316 796,762 15,779,470 Invested Capital: Total Assets – Current Liabilities (Brigham & Ehrhardt, 2011): 4,471,338 - 858,279: 3,61,3059 NPV = -677,316/(1.108) + 796,762/(1.108)^2, + 15,779,470/(1.108)^3 NPV = - 3,613,059 + 12,860,707: $9,247,647 IRR = 58% Average ROIC = 2013 2014 2015 ROIC 18.7% 22.1% 436.7% Average ROIC 159.2%     ROE = Previous Total Shareholders’ Equity: $3,256,581 (2011)   2013 2014 2015 ROE 20.80% 24.47% 484.54% Average ROE 176.60% Scenario #3: The Status Quo The third strategy is less active which follows equal emphasis in all business segments and further financing of the business activities by acquiring $1bn from external sources. Moderate growth is expected in the non-core businesses and a rapid decline in the automotive business is also expected. There are major risks if the company is not able to sustain the competitive forces in the existing business segments. Moreover, the deterioration in the automotive sector can be at much faster pace than expected. The financial analysis is based on the following assumptions: 1. All business segments other than the automotive segment will grow by an expected growth of 4% every year in the next 3 years. 2. The automotive sector is expected to decline by 37% every year. This is based on the average of decline in the EBT of the automotive business of the company.   Expected Cash Flow Business Segments 2012 2013 2014 Outdoor 178,094.80 185,218.59 192,627.34 Fitness 112,196.24 116,684.09 121,351.45 Marine 62,495.68 64,995.51 67,595.33 Automobile/Mobile 108,181.71 68,154.48 42,937.32 Aviation 76,155.04 79,201.24 82,369.29 Total 537,123.47 558,608.41 580,952.75 NPV = - 4,613,059 + 537,123/(1.108) + 558,608/(1.108)^2, + 580,952/(1.108)^3 NPV = - 4,613,059 + 1,366,877: - $3,246,181 IRR = Not possible as the rate is negative. Average ROIC = 2013 2014 2015 ROIC 10.51% 9.86% 9.26% Average ROIC 9.88%     ROE = Previous Total Shareholders’ Equity: $3,256,581 (2011)   2013 2014 2015 ROE 14.9% 14.0% 13.1% Average ROE 14% Summary Based on the above assessment, scenario #3 should not be availed because it is returning a negative NPV and low returns on invested capital and equity. While considering other two scenarios, both are returning positive NPV and IRR greater than the company’s capital cost therefore both scenarios are feasible. However, by comparing their results it could be suggested that scenario #2 is more attractive then scenario #1 as it generating higher IRR, ROIC and ROE as compared to the earlier scenario. This implies that the company should focus on its existing businesses as the company already has a leading market position and it could cash in its position by making it tougher for the competitors to pose any threat to the company. Moreover, this will give an opportunity to the company to expand in other related business segments to achieve better performance at a later stage. (2) Considering scenario #1, the company would have to raise equity from the capital markets which could dilute interests of the existing shareholders and thus, it may raise the cost of equity as shareholders will expect higher return on their holdings to compensate for the increase in number of outstanding shares. This could be in the form of higher dividends to be paid to shareholders or any repurchase of shares that the company may have to later offer to shareholders at a premium to the share price at the time (Gibson, 2010). Moreover, there is present a bearish sentiment for the company’s shares, which could also raise challenge for the company to raise $3 billion from floating its shares. Considering scenario #2, it is clear that the company will not raise any more funds from either banks or capital markets and therefore, there will no changes in the company’s capital structure. It is simply a case of focus existing resources of the company on the value added businesses of the company. This would reduce the level of equity as the retained earnings of the company will be used up for funding different business requirements (Gibson, 2010). Considering scenario #3, the company will obtain additional borrowing of $1bn that will have impact on the capital structure of the company. The interests of shareholders will be diluted as creditors will have to be paid before shareholders. Moreover, the company will have to generate more to compensate them for this distribution of funds. (3) In two scenarios 1 and 2, there is a positive NPV which implies that there will extra case arising from both. The company can use up this positive cash for further investment in the company’s businesses or acquiring other companies to enhance its position (Brigham & Ehrhardt, 2011). Furthermore, the company can pay higher returns to its shareholders to improve their confidence in the company’s stocks. This can be done by paying higher dividends or repurchase of the company’s stocks. Reference List Brigham, E. F., & Ehrhardt, M. C. (2011). Financial Management: Theory and Practice. Mason, OH: Cengage Learning. Brigham, E. F., & Houston, J. F. (2009). Fundamentals of Financial Management. Mason, OH: Cengage Learning. Gibson, C. H. (2010). Financial Reporting and Analysis: Using Financial Accounting Information. Mason, OH: Cengage Learning. Seeking Aplha. (2012, June 10). Why Garmin Is Not That Exciting. Retrieved December 13, 2012, from Seeking Aplha: http://seekingalpha.com/article/648941-why-garmin-is-not-that-exciting Read More
Cite this document
  • APA
  • MLA
  • CHICAGO
(“Garmin Analysis - Looking To the Future Research Paper”, n.d.)
Garmin Analysis - Looking To the Future Research Paper. Retrieved from https://studentshare.org/finance-accounting/1463235-garmin-analysis-looking-to-the-future
(Garmin Analysis - Looking To the Future Research Paper)
Garmin Analysis - Looking To the Future Research Paper. https://studentshare.org/finance-accounting/1463235-garmin-analysis-looking-to-the-future.
“Garmin Analysis - Looking To the Future Research Paper”, n.d. https://studentshare.org/finance-accounting/1463235-garmin-analysis-looking-to-the-future.
  • Cited: 0 times
sponsored ads
We use cookies to create the best experience for you. Keep on browsing if you are OK with that, or find out how to manage cookies.
Contact Us