StudentShare
Contact Us
Sign In / Sign Up for FREE
Search
Go to advanced search...
Free

Analysis of Competition Bikes Inc - Term Paper Example

Cite this document
Summary
The paper "Analysis of Competition Bikes Inc." focuses on the critical analysis of Competition Bikes Inc. The horizontal analysis of fundamental financial statements means comparing the financial data of a company for two or more years and it is termed horizontal analysis…
Download full paper File format: .doc, available for editing
GRAB THE BEST PAPER96.4% of users find it useful
Analysis of Competition Bikes Inc
Read Text Preview

Extract of sample "Analysis of Competition Bikes Inc"

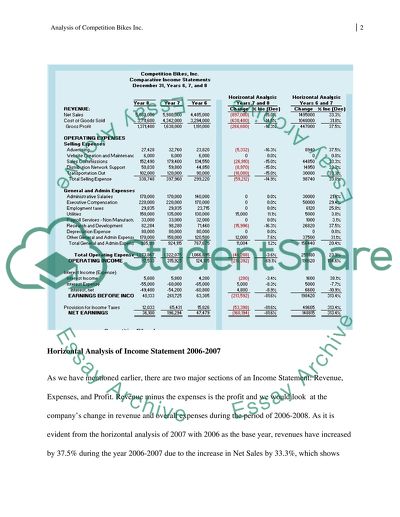
? Analysis of Competition Bikes Inc. Analysis of Financial ments Type here 8/30 Horizontal Analysis of Competition Bikes Inc. Thehorizontal analysis of fundamental financial statements means comparing the financial data of a company for two or more years and it is termed as horizontal analysis because the analyst compares the current item on the statement with the corresponding item on the previous year’s statement. The comparison is carried out using the actual values or percentage changes from year to year. The first step in a horizontal analysis is finding out the difference in the quantities comparing it with the base year. We first analyze the Income Statement horizontally. Income Statement is one of the fundamental financial statement that provides results of revenues, earnings, and EPS (Earning Per Share). The income statement provides a consolidated view of the revenue a company earned, the expenses it incurred and its effect on the bottom line, i.e. the profit during a certain period of time. It is a mirror to the investors reflecting on company performance and its potential to perform. Essentially a company should be earning more than it is spending and thus signal profit earning opportunity to the investors. The horizontal analysis of the Income Statement of Competition Bikes Inc. would compare the performance of the company during the year 2006-2008. The following is a snapshot of the Income Statement of company during 2006-2008 along with its horizontal analysis. We have compared the Income Statement of 2007 keeping 2006 as the base year and then analyzed the performance of 2008 keeping 2007 as the year of reference. Horizontal Analysis of Income Statement 2006-2007 As we have mentioned earlier, there are two major sections of an Income Statement: Revenue, Expenses, and Profit. Revenue minus the expenses is the profit and we would look at the company’s change in revenue and overall expenses during the period of 2006-2008. As it is evident from the horizontal analysis of 2007 with 2006 as the base year, revenues have increased by 37.5% during the year 2006-2007 due to the increase in Net Sales by 33.3%, which shows that the company is strong in its area of operation. The Cost of Goods Sold also increased by 31.8%, which is very close to the percentage change of Sales during the year, thus indicating that it is not a negative sign. It is a concern for the company even if the profits are high when the increase in Cost of Goods Sold is not relative to the increase in Sales. A definite weakness for any company is its increasing expenses, specifically administrative expenses. The Selling expenses also increased during the year by 33% including the expense on advertising that increased by 37% and administrative expenses increased by 20.4%. A major chunk of the administrative expense is the expenditure on Research and Developed which increased by 37.5%. The company believes in bringing a superior product to the market that has quality as well as first movers advantage with it, and it provides the company a strong selling potential. Thus, the overall increase in the expenses was by 24%, which is not a positive sign for any company, specifically increment in administrative expenses exhibit operational inefficiencies as the company cannot justify the expenses with any particular expansion project. However, a more clear idea of selling and administrative expenses as compared to the sales would be evident in the vertical analysis of the company. The operating income of the company, which is the revenue minus expenses increased by 154.6% and the overall profit before income tax and the Net Earnings increased by more than 300% showing abnormal but phenomenal growth. A horizontal analysis of year 2007 keeping 2006 as the base year reveals positive growth for the company in terms of Sales and the overall Net Earnings that shows that Competition Bikes Inc. is moving in the right direction and growing. The major strengths of the company lies in the increase in Sales whereas weakness of the company is increasing selling and administrative expenses. Horizontal Analysis of Income Statement 2007-2008 The Income Statement for the year 2008 differs completely from that of 2007. The Net Sales have declined to a large extent. A number of external factors such as recession, inflation, and competition have been responsible for the decline besides other factors. The adverse economic conditions are major reason behind the decrease of Net Sales by 15% was because professional riders who are permanent customers of the company had reduced amount of funding from their sponsors. The number of units sold during 2008 was 3400 whereas they were 4000 during 2007. Most professional riders prefer the CarbonLite Model and there is no change in the preference because of economic downturn. The positive aspect in this is that the Cost of Goods Sold are relative to the change in Sales, and as Net Sales declined by 15%, the COGS declined by 14.5%. The relativity of the COGS with Sales is a definite strength for the company as it suggests that it does not have a large amount of fixed costs. During the year 2008, Competition Bikes Inc. was able to cut down its administrative expenses and they only increased by approx. 1%, which shows that the company focused on improving its operational efficiencies and focused on reducing costs to improve profit margins. The company due to a decline in the Selling Trend reduced its expenditure on Research & Development and decreased it by 16%. Thus, the overall operating expenses decreased by 3%. As we have mentioned earlier, this was not a good year for the company in terms of Sales and they declined by 600 units, which would obviously impact the Net Earnings and they decreased by 81.6%. However, Competition Bikes Inc. plans to recover from the loss in the coming three years. They plan to increase their Sales gradually each year to recover completely from the loss. Horizontal Analysis of Balance Sheet Balance Sheet is also termed as the statement of financial condition. The balance sheet provides tremendous in-depth information about a company, how much a company owns, and how much are its liabilities. There are three major components of a Balance Sheet: Assets, Liabilities, and Equity. Following is a snapshot of Balance Sheet during the year 2006-2008 along with the percentage changes in values for the purpose of Horizontal Analysis. Horizontal Analysis of Balance Sheet 2006-2007 Current Assets of the company increased by 34% in 2007 from that in 2006 due to increase in short term investments and majorly due to increase in Accounts Receivables. As we have already witnessed in the Horizontal Analysis of the Income Statement during 2006-2007, Sales increased by 15% accounting to an increase in Accounts Receivables by 164%. Accounts Receivables are uncollected bills and an increase in them is neither absolutely negative nor positive. It completely depends on the ratio of Days Sales Outstanding (DSO), i.e. the average number of days a company takes to collect its outstanding bills. Therefore, it the DSO of a company is not very high, then it is a positive sign that the Accounts Receivables increased during the fiscal year. However, sales converted to cash is always most preferable as the case of bad debt is always possible. There was not much change in terms of increase or decrease in the Fixed Assets during the year 2006-2007. Moving over to the Liabilities Section of the Balance Sheet, we see that the Current Liabilities of the company increased drastically by 122% due to an abrupt increase of Accounts and Notes Payable by 192%. The increased figure indicates that company bought more Raw Material from the suppliers on credit terms that they need to pay within the end of the year. There is not much change in the Long term Liabilities or the Equity. Retained Earnings increased by 20% during the year pertaining to the 15% increase in Sales. Horizontal Analysis of Balance Sheet 2007-2008 As in the Income Statement, the declining trend is evident in the Balance Sheet. The Current Assets of the company increased by 16.5% pertaining to an increase in Cash and Cash Equivalents by 275.4% and decline in Accounts Receivables by 15%. Having plenty of cash on the Balance Sheet signals strong company performance and it is a positive sign for the investors signaling that the company is performing really well. However, it could also be a negative sign if there is loads of cash that is accumulating each year and becoming a permanent feature of the balance sheet signaling that the management is not investing it and is short sighted. Current Liabilities increased by 28.4%, however, increase in Accounts Payable was by 33.3% whereas the overall liabilities decreased by 1%. Decline in Sales impacted the Retained Earnings and they only increased by 3% during 2008. Vertical Analysis of Income Statement The vertical analysis of income statement, we divide each line of the income statement by Net Sales. Hence, Net Sales is always 100%. Following is a snapshot of the income statement with the calculations for vertical analysis. Vertical Analysis of Income Statement 2006 - 2008 Vertical Analysis describes how much each item on the Income Statement contributes to overall selling. The Cost of Goods Sold is 73% of Sales, i.e. for each dollar earned by the company, 0.73 goes into cost. Every company strives to reduce cost as lower costs increase the ability of a firm to generate positive cash flows. 73% of Sales in Cost of Goods Sold is not a good sign and the company should work towards reducing costs and maximizing efficiencies. The company can work towards reducing Direct Labor costs and the variable manufacturing overhead. The selling expenses are only 6.7% of the overall sales, which is a positive sign, moreover, the percentages are constant over the years which is yet another positive as it indicates if the percentages are decreasing, they are not increasing as well. The General and Admin expenses are 17%, 15%, and 18% of sales during 2006, 2007, & 2008 respectively. This expense shows an increasing trend and is a straight red flag for the company management to watch out. A company does not have a large amount of impact on the company sales, but general and admin expenses are completely under their control. The operating income is 2.8%, 5.3%, and 1.9% during 2006, 2007, and 2008 respectively. These figures need to be improved and they need to take up a larger chunk of the percentage sales. Similarly, the net earnings as a percentage of during the year 2006, 2007, 2008 are: 1.1%, 3.3%, and 0.7% respectively. Vertical Analysis of Balance Sheet 2006-2008 The following is a snapshot of the balance sheet during 206-2008 for the purpose of vertical analysis. For vertical analysis, total assets are taken as base for the assets portion, whereas all the other quantities are taken as a percentage of total assets to indicate how much each of the item on the balance sheet have contributed to increase in the total assets of the firm. Similarly, Total Liabilities and Equity and taken as base for the Liabilities and Equity portion. The balance sheet of 2006-2008 indicate that Net Property and Equipment form the major chunk of the total assets contributing to about 75.5%, 68%, and 63% during 2006, 2007, and 2008 respectively. The current assets of the firm contribute to more than 25% of the total assets during all the three years showing a good liquid position and stability for the company. However, this figure needs to be much more higher than what it is now. Similarly, major portion of the liabilities and equity is covered by Mortgage loans whereas Retained Earnings have taken over the next big chunk, which is again a positive sign indicating that the company does not have any high long term debts. Trend Analysis Trend analysis is the percentage changes in items of the financial statement during successive years. We can also call it an extension of the Horizontal Analysis and indicates the direction of change. Trend analysis of financial statements is carried out by calculating trend percentages. Trend percentages are the percentages calculated while keeping a base year at 100% and stating the percentages of all the other years as the base (Accountability Modules, 95). We are analyzing the trend in sales over the years and using it to predict future values: The historical trend in sales keeping 2006 as base shows irregularity as in 2007 it increased by 33% and declined in the next year due to a downfall in the number of units sold as a result of the recession. The decline in Sales was mainly due to recession and consequent reduction in the funding of professional bikers who are the major consumers of the company. Hence, they were not able to buy the bikes as they usually do resulting in the decline of the number of units sold. However, as the overall economy is recovering from the recession and credit crunch, the company plans to improve its performance in sales over the next three years, thus, keeping 2008 as the base year, the forecasted gradual increase in the next three years is indicative of the fact that the company would gradually try to increase its sales figures each year. The company hopes that the impact of recession would be completely gone by 2011 and they would also be able to not only recover from their decline in units sold but also experience substantial growth. The growth would not only result from the favorable economic conditions but also from extensive focus of Competition Bikes Inc. on its customers. The company plans to increase its customer base and have a diversified consumer base. Although, the company gets extensive word of mouth from its existing customers, the advertising efforts of the company are limited. In 2008, the forecasted growth is possible through extensive marketing tactics involving all sorts of digital and other media. Ratio Analysis Ratio Analysis is an effective measure of finding out the profitability of any firm. The most important ratios that indicate the financial health of a firm are the: Profitability ratios, Solvency Ratios, and Liquidity Ratios. The liquidity ratios indicate the ability of a firm to meet short term obligations, solvency ratios indicate if a firm can fulfill its long-term obligations, whereas profitability ratios indicate the ability of a firm to earn while covering costs. The following snapshot provides the most basic financial ratios of the firm Competition Bikes Inc. during 2007, and 2008 along with the financial ratio of its competitor Two Wheel Racing. The current ratio indicates the ability of a company to meet its short term obligations. It is consistently higher than the competitor, indicating that Competition Bikes Inc. is more liquid than its competitors. Acid-test ratio is similar to current ratio, it only subtracts the inventory as it is the least liquid of all the current assets to find out the liquidity position of the company. The acid-test ratio also shows that the company is performing better than Two Wheel Racing. A red flag for the company is in average collection period days, which is comparatively higher than the competitor. It is a specific red signal because the company relies heavily on accounts receivables for major part of its sales and they need to improve it to improve their profitability. The debt ratio of the company is higher than its competitor firm showing that the company’s assets are financed more with debt, which is better than financing them with equity because debt is tax deductible. All the profit margin ratios are less than Two Wheel Racing for both the years showing that the company is not doing well in terms of keeping a healthy profit margin. ROA (Return on Assets) is an important indicator of how assets of the company are contributing towards the net income. The ROA of the company is marginally lower than Two Wheel Racing during 2008 and comparatively equal during 2007. The reason behind marginal decrement is due to the 15% decline in sales during the same year. The PE ratio that defines the market valuation of the firm’s stock is higher than the competitor firm for both the years. However, the firm should not become complacent as Two Wheel Racing is a comparatively new player in the market and it can gain ground as it gains experience, customers, and expertise in the market. The most important indicator for an investor is the ROE ratio that explains how much return an investor gets on equity. Competition Bikes Inc. has an edge in this regard as during both the years, their ROE ratio is visibly higher than Two Wheel Racing signaling positive growth trend to the investors. Calculation and Analysis of Working Capital Working Capital is an effective indicator of firm’s short-term health and liquidity. It can be calculated by: Working capital = Current Assets – Current Liabilities Following table provides the Working Capital of Competition Bikes Inc. during 2006-2008. 2008 2007 2006 Current Assets 1606817 1379217 1029303 Current Liabilities 300,200 233,700 105,080 Working Capital 1,306,617 1,145,517 924,223 Positive working capital is always a good sign as it indicates that the company has enough cash, accounts receivables, inventory, etc. on their hands to pay off their current liabilities. Hence, a positive working capital is a definite strength for the company. However, a working capital that is increasing is not a good sign if the increase is due to increase in inventory and accounts receivables like in the case of Competition Bikes Inc. as it means operational inefficiencies. If more and more operational capital of the company is tied up in inventory and if the accounts receivables are not converting into cash, then the working capital might still be positive but it is a definite red signal for the company. The company purchases from its suppliers on a month’s credit, i.e. it pays the supplier at the end of the month. This also impacts the working capital. The ideal amount of working capital is not a fixed figure that can be stated, having said that the idea amount of working capital is one that is enough to meet the daily and monthly expenses. A company should have enough working capital that it can meet its operational expenses with some cash to spare (Barrage Marketing, 2011). Company can improve their Working Capital Management by focusing on improving their collection period of accounts receivables so that Sales are turned into cash faster. It would generate more cash flow and improve the working capital. The company can do so by offering incentives to the customers to pay cash by offering them discounts, etc. Another area where the firm needs to focus on is the procedure for collecting the receivables. The company needs to improve its collection procedure, judgment of credit, issue of invoices, etc. Secondly, the company uses up inventory while paying it by the end of month. This allows the company to keep the level of remaining inventory to a minimum, which is efficient management of working capital as very little amount of cash is consumed in inventory. Internal Controls for Competition Bikes Inc. The purchase procedure of the company is very simple and straightforward. The purchase department issues a purchase order depending on the projection. It checks the received quotations and selects the best three with similar quality and selects the lowest bidder. The purchase order is then sent to supplier on the first of the month and once the goods have been received, they are taken to the production line. Purchasing department forwards the invoice to the accounting department and the pay the invoice. Further analysis is required of each step as related to protection of assets, fraud, and separation of duties to identify additional weaknesses which are present. If we analyze each process of the purchasing process separately, we would be able to find out the weaknesses in the internal control procedure of the process. The most prominent weakness within the whole process is its vulnerability of manipulation and misstatement of data and information. As the company has not implemented an Enterprise wide Information System handling the flow of data and information from one department to another, it is possible for theft and misstatement of data during its path. Moreover, loss of data is also another threat in such an environment. As three departments are involved in the purchasing process with no particular department with designated control of the procedure, in case of a problem or a fault of any kind it would be very difficult to find the responsible authority and eradicate the problem. Nevertheless, the above procedure is simple and straightforward. Another weakness is that instead of taking quotations every time from various suppliers, the company can select one supplier that provides quality products and gives good rates. It would enhance the relationship with that supplier and in times when some part or product is short in the market, the supplier would still be bent upon on providing the product to the company. Moreover, it would also save time as the company does not need to scrutinize several suppliers each time. Effective internal control are necessary to ensure smooth running of operations. If the company does not ensure internal control, then it can run into irregularities, errors, and there would be chaos in the organization. Designation of tasks, responsibilities and exercising strict measures to ensure internal control is necessary to mitigate the risks. Risks Some of the risks identified earlier are: Unclear designation of authority and transfer of controls of the purchase process Decentralized transfer of data and information from one department to another allowing for misstatement, theft, and manipulation of data posing a threat to its reliability and accuracy Absence of a centralized Enterprise Wide Information Statement might cause loss of valuable data and information Absence of a strong relationship with any particular supplier that may cause threat to the company in case of shortage of raw materials Risk Mitigation The company can mitigate the above-mentioned risks by taking the following measures: Deploying an enterprise wide Information System that controls the flow of data and information while protecting it from theft, manipulation, and misstatement and ensures backing up of valuable data Instead of taking quotations each time a purchase decision is made, the company can select a suitable trustworthy supplier that has the ability of fulfilling the requirements of Competition Bikes Inc. and place their order with that supplier each time. This would ensure a strong and healthy relationship with the supplier. Not only the above mentioned step would save time, it would also ensure that Competition Bikes Inc. has an edge over other manufacturers by having adequate supply of high quality raw materials during times of shortage or other raw material related problems. Compliance with Sarbanes Oxley Requirements The Sarbanes Oxley Act 2002 is the legislation that came into being as a result of the fraudulent activities of Enron and WorldCom financial scandals. Although, the legislation is a very detailed one covering all aspects of financial reporting and corporate affairs, the three major highlights are: The first rules makes a corporation responsible of making sure that the financial records are free from falsification, destruction, alteration. Although the management of Competition Bikes Inc. is devoted towards compliance with the Act, not having a centralized ERP makes the financial records vulnerable to manipulation, theft, destruction, alteration, of data making them non-compliant with the requirement. The second rule of the Act is to make sure that all the valuable strategic data and records of the company including audit or review work papers, annual reports, etc. is archived for possible future reference. We can say that the company in this case is a possible candidate of non-compliance as they may be storing all the data in files and manually. However, this form of data storage leaves a lot desired as the data could be easily lost in case of any disaster. The right way is to use technology for data storage and backup ensuring that the data is securely archived for future reference of any sort. The third requirement is securing all business communication within the company and third parties. Competition Bikes Inc. communicates frequently with suppliers during its purchase process, customers, distributors, retailers, and within the departments of the company. However, the company is non-compliant with this clause of the Act as no records of the communication exists. The company can eradicate the problem by using emails for all sorts of communication external and internal while using phones, faxes, etc. so that the centralized information system can keep a record of the communication. (Spurzem, 2006). References Accountability Modules, (1995). Data Analysis: Analyzing data – Trend Analysis. Texas State Auditor's Office, Methodology Manual, rev. 5/95. Retrieved on September 4, 2011 from < http://www.preciousheart.net/chaplaincy/Auditor_Manual/16trendd.pdf> Barrage Marketing (2011). Tips On How To Choose The Ideal Amount Of Working Capital The Organization Must have. Retrieved on September 4, 2011 from < http://barragemarketing.com/?p=32713> Spurzem, Bob (2006). Sarbanes-Oxley Act (SOX). SearchCIO.com. Retrieved on September 4, 2011 from < http://searchcio.techtarget.com/definition/Sarbanes-Oxley-Act> Read More
Cite this document
  • APA
  • MLA
  • CHICAGO
(“Analysis of Competition Bikes Inc Term Paper Example | Topics and Well Written Essays - 1500 words”, n.d.)
Retrieved from https://studentshare.org/finance-accounting/1430726-finance-and-accounting
(Analysis of Competition Bikes Inc Term Paper Example | Topics and Well Written Essays - 1500 Words)
https://studentshare.org/finance-accounting/1430726-finance-and-accounting.
“Analysis of Competition Bikes Inc Term Paper Example | Topics and Well Written Essays - 1500 Words”, n.d. https://studentshare.org/finance-accounting/1430726-finance-and-accounting.
  • Cited: 0 times

CHECK THESE SAMPLES OF Analysis of Competition Bikes Inc

Competition Bikes Company

Horizontal analysis of competition bikes, Inc.... As evident from the horizontal analysis of the income statements of competition bikes, Inc.... competition bikes, Inc.... All these analyses have been performed for the competition bikes, Inc.... Horizontal analysis of the financial statements is generally done to compare the performance levels within the company for a given period of time (Weygandt, Kimmel, & Kieso, 2009, p....
12 Pages (3000 words) Coursework

Financial Analysis Term Paper

The following figure provides the calculations for the Breakeven Analysis of Competition Bikes Inc.... In the case of competition bikes inc.... If the fixed costs of competition bikes inc.... From the figure above, we can see that if competition bikes inc.... Bascially, this means that if competition bikes can sell more than 1415 units of the Titanium model and 786 units of CarbonLite, they would be able to earn profit....
5 Pages (1250 words) Term Paper

Marketing Plan-Situation Analysis

) which operates under Advanced Sports inc.... The main feature of Masi bikes are quality, speed, endurance with innovation at an affordable price.... The bike is light in weight as compared to other bikes and equipped with latest and modern frame.... The Masi CXR would be sold through intermediaries where the consumers would be encouraged to provide feedback regarding the bikes and the consumers will also be encouraged to take the bike for trials....
3 Pages (750 words) Essay

Harley Davidson Inc: Marketing Analysis

This paper "Harley Davidson inc: Marketing Analysis" discusses Harley Davidson inc as a famous motorcycle company that ranks 45th in Interbrand's 100 top brands.... Harley Davidson inc is a famous motorcycle company that ranks 45th in Interbrand's 100 top brands and is frequently listed in the 100 Fortune Big Best companies of the world.... In USA it is the predominant player but others like BMW and Honda are fast catching up using newer technologies to produce competing bikes....
8 Pages (2000 words) Case Study

Marketing Plan for Manchester E-Bike Inc

The author of this paper "Marketing Plan for Manchester E-Bike Inc" will examine the e-bike's venture by Manchester e-bikes inc.... These issues are the success factors of Manchester e-bikes inc.... his plan focuses on the company's growth strategy, suggesting ways in which Manchester e-bikes inc.... Since Manchester e-bikes inc.... anchester e-bikes inc.... According to Walker (2009), in 2012, over 20,000 e-bikes were sold in the United Kingdom....
13 Pages (3250 words) Essay

Harley Davidson Marketing Strategy for Proposed Indian Operations

A new entrant in the market is women who have shed their earlier shy image and now ride bikes and scooters.... Also, congestions in the cities have also made bikes a more attractive proposition.... The introduction of scooters and lighter bikes is helpful in adding women to the list of bikers and the utility value is enhancing the overall market.... While Harley Davidson (HD) has been seeing growth and profits for 19 consecutive years, it cannot be complacent in view of the growing competition....
6 Pages (1500 words) Case Study

Financial Analysis - Competition Bikes Inc

The paper "Financial Analysis - competition bikes inc " is a perfect example of a finance and accounting case study.... The paper "Financial Analysis - competition bikes inc " is a perfect example of a finance and accounting case study.... The paper "Financial Analysis - competition bikes inc " is a perfect example of a finance and accounting case study.... This report analyzes the financial statement for competition bikes inc by looking at different areas and factors so that a holistic view regarding the performance of the organization can be identified....
16 Pages (4000 words) Case Study

Harley Davidson Case

The company fuels 'the passion for freedom in our customers to express their own individuality' (Harley-Davidson's inc).... arley-Davidson's mission states that 'We ride with our customers and apply this deep connection in every market we serve to create superior value for all of our stakeholders' (Harley-Davisdon inc).... nother way is to obtain funding for HDFS by readjusting the costs of financing bikes through Harley-lending, and also establishing structured proposals with financial organizations to fund and approve the HD mania (Ryan & Wheelen, 2008)....
17 Pages (4250 words) Coursework
sponsored ads
We use cookies to create the best experience for you. Keep on browsing if you are OK with that, or find out how to manage cookies.
Contact Us