StudentShare
Contact Us
Sign In / Sign Up for FREE
Search
Go to advanced search...
Free

Investment Decision: Coca-Cola Vs. Pepsi - Assignment Example

Cite this document
Summary
In the paper “Investment Decision: Coca-Cola Vs. Pepsi” the author analyzes marketing strategies and compares Pepsi and Coca-Cola, two companies dominating the beverage and soft-drink market by heavily competiting for the market share and winning the trust of the consumers. …
Download full paper File format: .doc, available for editing
GRAB THE BEST PAPER95.2% of users find it useful
Investment Decision: Coca-Cola Vs. Pepsi
Read Text Preview

Extract of sample "Investment Decision: Coca-Cola Vs. Pepsi"

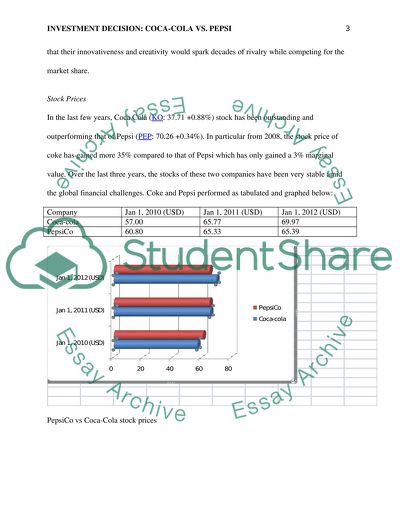
? INVESTMENT DECISION: COCA-COLA VS. PEPSI Background and products Pepsi and Coca-Cola are the two leading beverrage and soft drink companies globally. A report by the consumer survey in 2011 indicated that Pepsi and Coke are the most recognized and popular beverage brands. These two companies attempts to dominated the beverage and soft-drink market by heavily competiting for the market share and winning the trust of the consumers. These beverage and soft-drink companies therefore heavily invest in product promotion and marketing strategies to ehnance their competitiveness and remain popular among the beverage consumers globally. Being multination, Pepsi and Coca-Cola operates in all the five continents of the world. Coca-Cola uses a marketing phrase “Coke side of life” (Byrne, 2010) while Pepsi on the other hand uses “Hot stuff” and “Pepsi is in sync” (Pepsi-Cola, 2006) in their internet sites to popularize their brands. As evidenced in the product market, beverage and soft drink products from these companies make-up for over 80 percent of the global beverage industry. However, as expected, Pepsi and Coca-Cola are fierce business rivals with each company fighting for market dominance. Ironically, both Coke and Pepsi have a common origin as both companies were founded in the nineteenth century as a result of pharmaceutical innovation experience. Pepsi was formed in 1898 by a drugstore and pharmacist in North Carolina by the name Caleb Bradham. Coke was created by John Pemberton (an Atlanta Pharmacist) in the year 1886. However, John Pemberton did not live long to see the success of his innovation and enjoy the fruits of his creativity as he died only two years after forming Coke (Byrne, 2010). Little did these two pharmacists know that their innovativeness and creativity would spark decades of rivalry while competing for the market share. Stock Prices In the last few years, Coca Cola (KO: 37.71 +0.88%) stock has been outstanding and outperforming that of Pepsi (PEP: 70.26 +0.34%). In particular from 2008, the stock price of coke has gained more 35% compared to that of Pepsi which has only gained a 3% marginal value. Over the last three years, the stocks of these two companies have been very stable amid the global financial challenges. Coke and Pepsi performed as tabulated and graphed below: Company Jan 1, 2010 (USD) Jan 1, 2011 (USD) Jan 1, 2012 (USD) Coca-cola 57.00 65.77 69.97 PepsiCo 60.80 65.33 65.39 PepsiCo vs Coca-Cola stock prices From these graphs, it is evidenced that over the three years, these two companies had a steady stock prices. The stock prices increased steadily between Jan 1, 2010 to Jan. 1, 2012. However, Pepsi stock traded at higher prices than those of Coke over the same period. By volume traded over the same period, the two companied performed and tabulated below Company Jan 1, 2010 Jan 1, 2011 Jan 1, 2012 Coca-Cola 10,848,800 10,773,400 7,862,000 PepsiCo 3,316,300 2,977,400 2,833,700 When compared in terms of sales volume, coca-cola drastically dropped in volume especially between Jan 2011 and Jan 2012. Though the volume of Pepsi stocks traded over the same period decline, it was a bit stable as there was no drastic drop in the volume of stocks traded in the NYSE. Ability to meet short-term liabilities With tight beverage and soft-drink market of the United States, Pepsi and Coca-Cola have no choice but to source alternative to revenue on order to increase with their expansion and growth strategies. As a result, these companies have adventured into alternatives as opposed their traditional beverage and soft drink customs. For instance, Pepsi broke into snack food industry with products such as Frito-Lay and Tostitos. On the other hand, Coca-Cola has boosted its revenue earnings by adventuring into water and mineral market both locally and internationally (Byrne, 2010). Over the last three decades, there has been a significant difference in stock market with Coca Cola out-performing Pepsi. In 2011, Pepsi stock only managed a marginal gain of 3% while Coca Cola recorded a 35% gain in stock prices. In terms of dividends pay out ration, Coca Cola allocated 52% of their after-tax returns to investors while Pepsi only paid out 13% of their returns to shareholders in dividends. Wall Street economists estimate that by market share, Coca Cola cap 33% more than does Pepsi. Returns of Pepsi and Coke Company 2009 2010 2011 2012 Coke (%) 4.42 10.82 16.20 42.67 Pepsi (%) 2.93 9.24 12.67 21.33 The ability of a firm to meet its short-term liabilities when they fall due is measured by the company’s quick acid ratio (also referred to as current ratio). The current assets of the firm are cash, receivables, and inventories while current liabilities include debts and payables. Therefore, a higher current ratio represents the higher ability of a company to pay its short-term obligations. Any ratio less than unitary (X1) is an indication of current illiquidity of the corporation to pay its current debtors. Though this is an indication of inability of the company to meet its short-term financial obligations, it is does not imply bankruptcy of the firm. This is because firms have many alternative sources of financial resources, although, this is not financially healthy (Noreen &Brewer, 2012). Based on the 2011 financial statements of Coke and Pepsi, Pepsi reported a superior current ratio index of X1.279 while Coke financial statements showed quick acid ratio of X1.436. Current ratio provides the sense of financial efficiency of the firm in terms of its operating cycles and ability to change products into liquid cash. Based on the above statistics, it is clear that Pepsi are well placed to meet their current or short-term financial obligations well they fall due than Coke because of the superior current ratio index. These figures indicate that the current assets of Pepsi exceed current liabilities by approximately 1.5 as opposed to Coca-Cola with 1.279. This is an indication of better financial performance than Coca Cola. Profitability of Indices of Pepsi and Coke Currently, in terms of revenue, Pepsi out performances Coca Cola by generating over 40% more than what Coca Cola generated over the same time. In 2011, the revenue gap between these two firms widen further. According to Wall Street reports, the sales revenue of Pepsi is expected to grow further and more than double that of Coca Cola. This increase in sales volume and profitability index of Pepsi is attributed to product diversification portfolio and reduced market risk. The Return on Assets (ROA) indicates the profitability index of the company with respect to the firm’s total assets. ROA is also an indicator of efficiency in financial management of assets to generate earnings for the firms. ROA = Net income / Total Assets and is also referred to as “return on investment”. Therefore, it represents the gains from asset investment (McKay, 2012). Another measure of financial performance of a corporation is Return on Equity (ROE) which is the amount of net returns expressed as a percentage of shareholders investments or equity. ROE is the measure of profitability of the firm from the resources invested by the owners. It is measured as: ROE = net income/shareholder’s equity (Noreen &Brewer, 2012). Based on the analysis of the financial statements of Pepsi and Coke over the last three years, the following statistics were reported: Return on Asset (ROA) Company 2009 2010 2011 PepsiCo 16.34% 14.29% 14.92% Coca-Cola 13.82% 14.33% 14.02% Return on Equity (ROE) Coca-Cola 29.24% PepsiCo 36.03% From these financial statistics, it is clear that Pepsi is financial performing better than their decade long competitor, Coke. Cash Flow & Investment Valuation Ratio Both Pepsi and Coke are offering the same dividend yield of about 3 percent. However, the dividend payout ratio of Coke is slightly more than that of Pepsi; the difference is very marginal in statistical values. In the last financial year (2011), Coca Cola traded at 16X consensus earning value. On the contrary, Pepsi traded at 15X 2011 EPS earnings. Although Wall Street expect these two beverage dominant firms to record a 12% increase in their earnings in the financial year of 2012, the strong revenue growth posted by Pepsi provides an increased opportunity for investors. TTM P/E for the last 5 years We can observe from above figure, Coca-Cola traded at a higher P/E than did Pepsi in the last five years. However, it the 2011, Pepsi traded at a relatively higher P/E over Coke. The changes in 2011 can be partially explained by large debt refinancing policy adopted by Coke in 2011 as the company reported zero gain in EPS. Pepsi on the other hand, had a better P/E performance. TTM Net Income From this graph, it is evidenced that Coke’s income has grown relatively faster than that of Pepsi since 2008. However, between 2011 and 2012, Coke reported a drastic decline in income while Pepsi’s income remained low but stable. This was an open win for the Coke. TTM Revenue Over the last 5 years, both Coke and Pepsi have posted an increasing growth in revenue. Though both companies have consistent revue income, Pepsi has posted higher revenue than Coke throughout the 5 year period. This is an indication of increase sales volume for Pepsi as the company moved into snack food industry to add to its current beverage production capacity (Deogun, 2011). The Dividend Payout Ratio As pictured in the graphs above, historically, Pepsi trades at lower yield in dividends than does Coca-Cola. However, given its slower rate of market growth, Pepsi currently trades at higher annual yield than Coke. This is an indication of superiority in dividends for Pepsi. In terms of growth, Coca-Cola has openly overpowered Pepsi over the last five years. Coke as posted a steady dividend growth while that of Pepsi has been very unstable since 2008. On average, Pepsi recorded approximately 7.52% while had an average growth of 8.44%, hence the winner of dividend growth (Enrico & Kornbluth, 2008). Balance Sheet (Pepsi vs. Coke) The financial statement of these two companies since 2008 indicates that Pepsi’s long-term debts has been steadily increasing reaching a record of USD 23.73 billion in the third quarter of 2012. Besides, the cash and cash equivalence for Pepsi has been unsteady between 2011 and 2012 and also falling short of that of Coca-Cola (Pepsi-Cola, 2006). The long-term debts of Coke are less than that of Pepsi since 2008. From these figures, it worth concluding that Coke is better off than Pepsi is terms of the cash availability and debt management. Pepsi has limited cash and cash equivalence over the same period, implying that Coca-Cola performs better than Pepsi. Summary/Overview TTM P/E: Coke looses and PepsiCo wins TTM Net Income: Pepsi looses as Coca-Cola wins TTM Revenue: Pepsi looses at the expense of Coca-Cola Dividend Yield: Coke is outperformed PepsiCo Dividend Growth: Pepsi looses to Coca-Cola Balance Sheet: Pepsi under-performs while Coca-Cola wins Investment Decision (Coca-Cola vs. Pepsi) Notably, the war between Pepsi and Coke goes beyond consumers’ choices on which brand to consume between those produced by Coke or Pepsi. This baffle extends to investor whose main objective is to find value for their investment by maximizing on the returns of their investments and wealth. Even though these companies stand a better chance of benefiting from the consumer expenditure recovery, it is apparent that Coke has weaker fundamentals when compared to Pepsi. For investors who are solely after dividend stock safety with potential of growth, Pepsi is a better investment alternative than Coke. Fundamentally, Pepsi has a slight advantage over Coke. Although Coke reports huge figures, Pepsi records shows a better revenue, profits, and operating margins than Coke, which are more essential for company growth. According to Yahoo Finance, it is apparent that Pepsi has been regularly upgraded in the last five months, which is a positive sentiment for investment institutions. In regard to guidance, both Pepsi and Coca-Cola look forward to securing better procedures for their products in the emerging and competitive markets (Byrne, 2010). Although this would hurt their earnings, in the long-run, this will boost their economic scales of production. In terms of EPS, in the last three quarters, both companies reported positive statements with insignificant differences which barely affect their share index. In making investing choices, technical analysis is very critical. Over the last 2 years, Coca-Cola has been stable in the range of five dollars, which is an indication of stability especially for investors or speculators. Though this level of stability is more encouraging particularly for fixed investors, in reality, from 2000, Coke has barely reported fluctuations in the 20 point range, an indication of lack of limited sign of growth (Deogun, 2011). Like Microsoft, it is apparent that has reached its maximum in value and sooner than imagined, the company will start suffering from diseconomies of scale, thus causing its share prices to drop. Pepsi on the other hand, has reported a continuous and steady growth over its tenure. Though the slow appreciation in the stock prices of Pepsi may discourage speculators, in the long-term, investing in Pepsi would prove more fruitful than Coca-Cola because the stock value of Pepsi are yet to reach its peak and therefore will appreciate further in the near future. Pepsi is still in its prime career and will carry its stocks to higher figure both shares and fundamentals in decades to come before attaining peak. By investing in Pepsi today, investors would see the company rise to 80-100 points come 2012. Though these investors will have to be patient and wait than reaping immediate returns as their colleagues who would prefer to invest in Coca-Cola, the long wait will be more stress free for these long-term investors as their capital gain from investing in Pepsi would be rewarding through capital gains. In addition, investing in Pepsi is relatively favorable with the dividend payoff policy which allows investors to reinvest in order to increase their future earnings (Enrico & Kornbluth, 2008). Investment based on Non-Financial Reports The appointment of a new CEO with an Indian origin to manage Pepsi looks more favorable and competitive in the emerging global market than that of Coca-Cola. While Coca-Cola for a long time has been the king of beverage industry, the market is apparently changing in favor of other firms like Pepsi. This follows increased investment in product promotion and advertising made by Pepsi. Besides, Pepsi has increased its investment on technology to increase their productive capacity and quality (Pepsi-Cola, 2006). According to market analysts, the diversification into snack foods such as Quaker Oats and Frito-Lays is a virgin invention with great potential of generating more revenue. Thus, going beyond financial records, Pepsi is a better investment opportunity than Coca-Cola. References Boards of Pepsi-Cola and Frito-Lay, (2006). Approve Merging As PepsiCo,' Wall Street Journal, February 26, p. 8. Byrne, John A., (2010). 'PepsiCo's vs. Coca-Cola, New Formula,' Business Week, April 10, 2000, pp. 172--76&. Deogun, Nikhil, (2011). 'Pepsi Challenge: Can Company's Brass Mute Flashy Culture and Make Profits Fizz?,' Wall Street Journal. Dietz, Lawrence, (2004). Soda Pop: The History, Advertising, Art, and Memorabilia of Soft Drinks in America, New York: Simon and Schuster. Duncan, Amy, (2009). 'Pepsi's Marketing Coke: Why Nobody Does It Better,' Business Week. Enrico, Roger, and Jesse Kornbluth, (2008). The Other Guy Blinked: How Pepsi Won the Cola Wars, New York: Bantam. Garrison Noreen & Brewer, (2012). Managerial Accounting, 14th Edition Mcgraw Hill Test Bank Managerial Accounting, NY: Mcgraw Hill. http://moneycentral.msn.com/detail/stock_quote?Symbol=ko&getquote=Get+Quote http://www.investopedia.com/university/ratios/operating-performance/ratio1.asp McKay, Betsy, and Nikhil Deogun, (2000). 'PepsiCo's Enrico to Pass CEO Baton to His Number Two by End of Next Year,' Wall Street Journal. McKay, Betsy, (2012). 'Juices Up: Pepsi Edges Past Coke and It Has Nothing to Do with Cola,' Wall Street Journal. Read More
Cite this document
  • APA
  • MLA
  • CHICAGO
(“Investment Decision: Coca-Cola Vs. Pepsi Assignment”, n.d.)
Retrieved de https://studentshare.org/finance-accounting/1402018-investment-decision-coca-cola-vs-pepsi
(Investment Decision: Coca-Cola Vs. Pepsi Assignment)
https://studentshare.org/finance-accounting/1402018-investment-decision-coca-cola-vs-pepsi.
“Investment Decision: Coca-Cola Vs. Pepsi Assignment”, n.d. https://studentshare.org/finance-accounting/1402018-investment-decision-coca-cola-vs-pepsi.
  • Cited: 0 times

CHECK THESE SAMPLES OF Investment Decision: Coca-Cola Vs. Pepsi

Coca-Cola and Pepsi Cola Wars

The paper "Cola Wars" describes Coca-Cola and pepsi cola are the leading organizations in the world market for carbonated soft drinks.... Strong competition between pepsi and Coca-Cola has been in the soft drink industry for more than a century.... pepsi, on the other hand, also intensified its advertising from 66 million dollars to 125 million dollars during the same period.... Coca-Cola introduced eleven new products and pepsi introduced thirteen new products....
6 Pages (1500 words) Essay

Coca Cola Financial Analysis

The paper also notifies the positioning of Coca-Cola's biggest competitor; pepsi Cola's financial condition.... pepsi Cola International is the biggest competitor of Coca Cola and retains a prominent position in the industry too.... The business endeavours of Coca Cola are far more than pepsi, and financial analysis of the previous years indicate Coca Cola's lead in the industry (Clarkson 18).... With more than 500 brands and 90,000 employees, coca-cola holds a promising place in the beverage industry and is considered as the market leader....
9 Pages (2250 words) Case Study

Investment Analysis of Coca Cola and Pepsi

It was first developed as pepsi in 1880s by a pharmacist and industrialist based in New Bern, North Carolina named Caleb Brandham.... It was first developed as pepsi in 1880s by a pharmacist and industrialist based in New Bern, North Carolina named Caleb Brandham.... Later he formed pepsi-Cola Company in 1902.... In 1965, pepsi-Cola Company was merged with Frito-Lay, Inc.... pepsi made the tough decisions because they expected that the companies will face higher input cost of the raw materials as compared to other previous years....
12 Pages (3000 words) Essay

Liquidity Measurement Ratios of Coke and Pepsi

pepsi reported a current ratio of 1.... pepsi's current ratio for the year ended 2011 was however 0.... Consequently, pepsi experienced an improvement in its ability to meet its current liabilities, from the year ended 2011 to the year ended 2012 (Debarshi, 2011).... pepsi is doing better in management of its current assets and liabilities, into better solvency.... In addition, pepsi improved its ratio in the year 2012 while the ratio for Coca Cola decreased to suggest better management in pepsi than in Coca Cola....
3 Pages (750 words) Essay

Organisations Management at Coco-Cola

This paper provides an analysis of the organisations management at Coco-Cola.... It has become the most valuable brand in the world.... Not only coke it also manufactures many other flavors of soft drinks like Fanta, Sprite, ready to drink coffee, juices, etc.... hellip; The production of soft drinks was mainly started in 1830....
8 Pages (2000 words) Case Study

Coca-Cola Company Business Performance

It mainly deals in manufacturing and selling of non alcoholic beverage.... The company has its headquarters in Atlanta, Georgia.... John Stith Pemberton invented Coca Cola in 1886 and the company was formed in 1892.... The company operated… It is the world's leading soft drinks manufacturing company which operates its business in more than 200 countries of the world....
13 Pages (3250 words) Essay

Financial Ratios of Coca-Cola and PepsiCo

The company established itself as a merger of Frito-Lay and pepsi-Cola in 1965.... The study “Financial Ratios of coca-cola and PepsiCo” will review the financial ratios of the two corporations and determine which of them is better performing according to the market statistics.... hellip; The analysis will then proceed to determine the better company for investment based on the analysis developed....
6 Pages (1500 words) Assignment

Coca Cola as One of the Famous American Soft Drinks

This essay analyzes coca-cola that is the world's largest non-alcoholic beverage company.... hellip; This essay discusses that coca-cola is marketed globally in different countries and different cultures.... “In May 1886, coca-cola was invented by Doctor John Pemberton a pharmacist from Atlanta, Georgia.... Today, products of the coca-cola Company are consumed at the rate of more than one billion drinks per day.... (Bellis, 2009)Today, the coca-cola Company and more than 300 worldwide bottling partners work together as the coca-cola system to deliver daily refreshment and drive to their global success” (Business, 2009) “Operating in over 200 countries with over 50,000 employees and more than 800 production and distribution centres” (Coco-Cola Key Success Factors, 2009) Research shows that its trademark is recognized by over 94% of the world's population Innovative business strategies keeping in pace with the needs of the changing world made Coca Cola one of the all time great companies in the world at present....
19 Pages (4750 words) Essay
sponsored ads
We use cookies to create the best experience for you. Keep on browsing if you are OK with that, or find out how to manage cookies.
Contact Us