StudentShare
Contact Us
Sign In / Sign Up for FREE
Search
Go to advanced search...
Free

Spot Oil Price: West Texas Intermediate - Statistics Project Example

Cite this document
Summary
"Spot Oil Price: West Texas Intermediate" paper studies the behavior and patterns of monthly oil prices from 1st January 1946 to 1st July 2014. It is evident that the oil prices have been very volatile with high prices being recorded in the year 2007/2008. …
Download full paper File format: .doc, available for editing
GRAB THE BEST PAPER91.8% of users find it useful
Spot Oil Price: West Texas Intermediate
Read Text Preview

Extract of sample "Spot Oil Price: West Texas Intermediate"

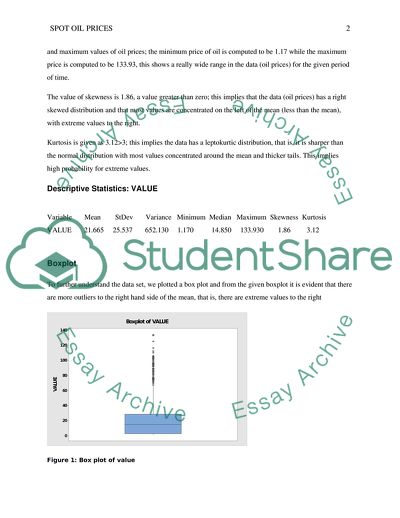
Spot Oil Price Sur Sur First org; Second org; -In this paper, we study the behaviorand patterns of monthly oil prices from 1st January 1946 to 1st July 2014. It is evident that the oil prices have been very volatile over this period of time with high prices being recorded in the year 2007/2008, a year regarded as a period of global financial crisis. The average oil prices were computed to be $21.665 per barrel with a large standard deviation of 25.537. The Mean Absolute Percentage Error (MAPE), Mean Standard Deviation (MSD) and Mean Absolute Deviation (MAD) were computed as 37.567, 137.866 and 7.195 respectively. The value for MAPE indicates that on average the forecast is off by 37.567% Key words: volatile, MAPE, MSD, MAD Introduction Forecasting is both a Science and an Art. It is capable of recognizing patterns by use of logical and analytical methods. With forecasting, managers and economists are able to understand and predict the future (Makridakis & Wheelwright, 1989). The study sought to understand and forecast future oil prices. Data The data was a time-series spanning from 1st January 1946 to 1st July 2013. A total of 811 months (observations) were collected for this study. Analysis Descriptive Statistics We begin by looking at the descriptive statistics of the data. The average oil prices are computed to be $21.665 per barrel with a large standard deviation of 25.537 (with a variance of 652.13); this implies that there is large variation from the mean. To affirm large variations from the mean, we look at the minimum and maximum values of oil prices; the minimum price of oil is computed to be 1.17 while the maximum price is computed to be 133.93, this shows a really wide range in the data (oil prices) for the given period of time. The value of skewness is 1.86, a value greater than zero; this implies that the data (oil prices) has a right skewed distribution and that most values are concentrated on the left of the mean (less than the mean), with extreme values to the right. Kurtosis is given as 3.12>3; this implies the data has a leptokurtic distribution, that is, it is sharper than the normal distribution with most values concentrated around the mean and thicker tails. This implies high probability for extreme values. Descriptive Statistics: VALUE Variable Mean StDev Variance Minimum Median Maximum Skewness Kurtosis VALUE 21.665 25.537 652.130 1.170 14.850 133.930 1.86 3.12 Boxplot To further understand the data set, we plotted a box plot and from the given boxplot it is evident that there are more outliers to the right hand side of the mean, that is, there are extreme values to the right Figure 1: Box plot of value Histogram The shape of the graph shows no evidence that the data (oil prices) follows a normal distribution Figure 2: Histogram Test for normality In this section, we test whether the data follows a normal distribution using goodness-of-fit tests. We used Anderson-Darling test which is normally used to test if a sample of data came from a population with a specific distribution. The test is a modification of the Kolmogorov-Smirnov (K-S) test that gives more weight to the tails than does the K-S test. Figure 3: Normality plot In the figure above, we observe the p-value to be less than 0.05 (significance level), we thus reject the null hypothesis and conclude that indeed the data set does not follow normal distribution. Which particular distribution fits the data? Since the data does not follow a normal distribution we used Individual Distribution Identification to help us decide which distribution best fits the current data. Figure 4: Probability plot We look at the distribution with data points that approximately follow a straight line and with the highest p-value. In this case, the 2-parameter Exponential distribution is a better fit than the others because the data points roughly follow a straight line and its p-value is the highest. Time series Considering the time series plot shown below, we see that the oil prices remained fairly constant between 1946 to around 1974, the prices trading below $3 per barrel. In 1975 saw a slight increase which went on till 1980 when it reached a price of $37 per barrel. The prices then started going down save for the 1990 when there was a drastic increase. The prices then maintained somehow a constant price up to a round the year 2001 with slight increase and decrease here and there before it embarked on an increase mission. A period of 2007-2008 saw a climax of the prices having hit the highest ever the high prices during this period of time are attributed to the global financial crisis (Hamilton.J, 2009). However, the prices tremendously fell in the subsequent years (years after 2007/2008). This shows, in turn, the presence of a healthy financial sector to the task of restoring economic growth (Elliott & Baily, 2009). Figure 5: Time series plot Trend analysis Trend can be described by a straight line or a smooth line. Linear trend: Where is the predicted value for the trend at time . The symbol is used to represent the time variable and it takes integer values is the slope value which represents the average decrease or increase in for each period increase in time. Time trend equations can be fit to the data using the method of least squares (LS). We are able to forecast future prices of oil based on the trend analysis. The fitted equation for the trend equation is given below; Fitted Trend Equation Figure 6: Trend analysis plot Oil price forecasts Using the fitted trend equation we forecast the oil price for the next one year as follows; Date Price 2013-08-01 79.4603 2013-09-01 79.8512 2013-10-01 80.2441 2013-11-01 80.6389 2013-12-01 81.0356 2014-01-01 81.4343 2014-02-01 81.8350 2014-03-01 82.2376 2014-04-01 82.6422 2014-05-01 83.0488 2014-06-01 83.4574 2014-07-01 83.8680 Figure 7: Residuals plot Measuring Forecasting accuracy Measure of forecasting accuracy is a fundamental concern for any given forecasting method and the data set. According to (Makridakis & Wheelwright, 1989), accuracy is a measure of “goodness of fit” that shows how well the forecasting model is capable of fitting a new data set. In this study we used three standard measurement errors; Mean Squared Deviation (MSD), Mean Absolute Deviation (MAD) and Mean Absolute Percentage error (MAPE). Mean Squared Deviation (MSD) Is a commonly used measure of accuracy of fitted time series values. For this measure, outliers are assumed to have a less effect on MAD than on MSD. The equation is: Where  equals the actual value,  equals the forecast value, and  equals the number of observations. Mean absolute deviation (MAD) MAD expresses accuracy based on the same units as the data, in turn the measure helps conceptualize the amount of error. Outliers have great effect on MSD than on MAD. The equation is: Where  equals the actual value,  equals the forecast value, and  equals the number of forecasts. Mean absolute percentage error (MAPE) MAPE expresses the forecasts accuracy as a percentage of the error. Since this measure is a percentage, it can easily be understood than the other measures. For instance, if the MAPE is 10, on average, the forecast is off by 10%. The equation is: Where  equals the actual value,  equals the forecast value, and  equals the number of forecasts. Results The accuracy measures are given as shown below; Accuracy Measures MAPE 37.567 MAD 7.195 MSD 137.866 In the above table, the Mean Absolute Percentage Error (MAPE) is shown to be 37.567, which indicates that on average the forecast is off by 37.567%. Conclusion The Oil prices have not been constant; they have been volatile and have kept on changing based on the financial situation. The worst prices being in 2007/2008 year, a year the whole world experienced global financial crisis. It is possible or even likely that the worst is over in financial markets and the economy will slowly start to mend. The forecasts show less risk, however, the markets and policymakers should not relax. Public policy makers should work on the various existing initiatives and keep its focus on the economic crisis and financial markets, even if it seems that financial recovery is on its way. References Hamilton, J. D. (2009). Understanding Crude Oil Prices. The Energy Journal, 30, 179-206. Elliot, D., & Baily, M. N. (2009). Telling the Narrative of the Financial Crisis: Not Just a Housing Bubble. The Initiative on Business and Public Policy. Retrieved May 26, 2014, from http://www.brookings.edu/~/media/research/files/papers/2009/11/23%20narrative%20elliott%20baily/1123_narrative_elliott_baily.pdf Makridakis, S., Wheelwright, S, C., (1989). Forecasting Methods for Management, John Wiley & Sons, New York, p.3. Read More
Cite this document
  • APA
  • MLA
  • CHICAGO
(Spot Oil Price: West Texas Intermediate Statistics Project Example | Topics and Well Written Essays - 1500 words, n.d.)
Spot Oil Price: West Texas Intermediate Statistics Project Example | Topics and Well Written Essays - 1500 words. https://studentshare.org/statistics/1829632-spot-oil-price-west-texas-intermediate-discontinued-series
(Spot Oil Price: West Texas Intermediate Statistics Project Example | Topics and Well Written Essays - 1500 Words)
Spot Oil Price: West Texas Intermediate Statistics Project Example | Topics and Well Written Essays - 1500 Words. https://studentshare.org/statistics/1829632-spot-oil-price-west-texas-intermediate-discontinued-series.
“Spot Oil Price: West Texas Intermediate Statistics Project Example | Topics and Well Written Essays - 1500 Words”. https://studentshare.org/statistics/1829632-spot-oil-price-west-texas-intermediate-discontinued-series.
  • Cited: 0 times

CHECK THESE SAMPLES OF Spot Oil Price: West Texas Intermediate

Price of the Market

These investments play a huge role in assessing the cost of capital(intermediate Financial Management).... (Similar example can be found in intermediate financial management)We can better comprehend this with an example.... (intermediate Financial Management) This is why CAPM recommends companies to maintain a diverse portfolio of investment (Equilibrium in a Capital Asset Market).... The paper entitled 'price of the Market' focuses on investors in the form of companies or individuals, whenever who make investments, they always expect a return....
2 Pages (500 words) Essay

Trace the events surrounding the Birth of Texas

texas, like other states has housed many large events in its history.... These events are responsible for the birth of texas.... texas became a state in 1845.... texastexas even held its own president during this time.... Although many events shaped the birth of texas, these three specific events shaped texas Texan History, Events That Shaped Its Birth The of texas has a large history that has changed over time in order to shape texas into the state it is today....
2 Pages (500 words) Essay

Demand and Supply of Oil

hellip; The article mentions how the price of Western texas intermediate has dropped to its 22 week low, much in line with International Energy Agency's forecast which determined that oil demand in 2014 would increase at its slowest pace ever since 2009.... The article mentions how the price of Western texas intermediate has dropped to its 22 week low, much in line with International Energy Agency's forecast which determined that oil demand in 2014 would increase at its slowest pace ever since 2009....
2 Pages (500 words) Case Study

Falling oil prices are bad for the economy

The greatest beneficiaries in the reduction… This is because they are able to buy gas at a reduced price, per gallon.... 0 per gallon, down from the previous price of 4.... Russia is also another country that is negatively affected by a low price of oil (Johnson, 5).... Just as Venezuela, the Russian bonds are trading at a very low price, and this means that the two countries are experiencing a recession.... This is more than a half of the reduction in the prices of oil....
5 Pages (1250 words) Essay

Collapse of Oil Prices

However, in the second phase, the oil prices for the crude oil dropped further to $ 50 and IMF suggests that a decrease in the oil price was due to increased demand.... The results indicated that during the first phase the oil price drop was attributed by weak global demand.... However, in the second phase, the oil prices for the crude oil dropped further to $ 50 and IMF suggests that a decrease in the oil price was due to increased demand.... The IMFBreaks Down the Collapse of oil price....
1 Pages (250 words) Essay

Effect Of Oil Price Change

The paper "Effect Of oil price Change" aims to forecast commodity prices such as that of oil.... The oil price at the market equilibrium is the market price of oil at that given time.... The demand and supply framework of oil price changes is very complex and becomes understandable when divided into two.... The short-run responses to oil price changes refer to the immediate changes in the event of an oil price change....
4 Pages (1000 words) Essay

What Can be Caused by Rising Oil Prices

here need to be certain price levels with regards to oil since it has a huge impact on the economy of a particular nation.... (Tannenbaum, 2008) The rising price issues need to be tackled in such a way that the $148 a barrel price never comes back to such exorbitant levels – levels that have haunted people like no other issue in the recent past.... The essay "What Can be Caused by Rising oil Prices" talks about how it is a common phenomenon the world over that the oil prices have impacted the basis of economies and have been able to bring about changes at the top when the masses have come out in the streets and raised their voice against the discriminatory effects that the oil prices seem to have on their lives....
8 Pages (2000 words) Essay

What Sets Oil Prices

oil price fluctuation affects countries differently.... Politics also play part in the oil price indices determination.... Purchasing companies and the selling companies only use the oil price indices as the benchmark, but not the determinant in oil pricing.... There are factors that lead to the price instability of oil despite the price indices the price of crude oil may not be the determining factor of gasoline prices....
1 Pages (250 words) Essay
sponsored ads
We use cookies to create the best experience for you. Keep on browsing if you are OK with that, or find out how to manage cookies.
Contact Us