StudentShare
Contact Us
Sign In / Sign Up for FREE
Search
Go to advanced search...
Free

Using Statistical Software Package - Assignment Example

Cite this document
Summary
From the paper "Using Statistical Software Package" it is clear that generally, the small vehicle type is not the preferred vehicle type in all three cities and the Large vehicle type is not the preferred vehicle type in the city of North San Francisco…
Download full paper File format: .doc, available for editing
GRAB THE BEST PAPER97.6% of users find it useful
Using Statistical Software Package
Read Text Preview

Extract of sample "Using Statistical Software Package"

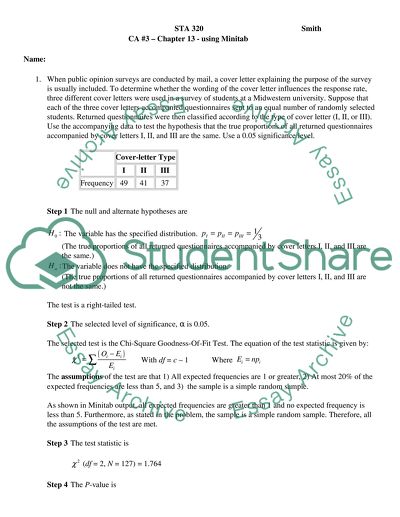
CA #3 –Chapter 13 - Using Statistical Software Package Use Minitab to calculate the appropriate hypothesis test for the given problems, paste the corresponding Minitab output from the session window for each problem. State the null and alternative hypotheses, state α, state the equation of the test statistic, check assumptions, state test statistic, and state p-value. Do not perform any calculations; MINITAB has done them for you! Just find the values of the test statistic and the p-value on your Minitab output. State your conclusion using words relevant to the problem. Assignments will be graded using the following rubric: 1. ________ Word file attached in BB – 5 pts 2. ________ Minitab project file attached in BB – 5 pts Problem 1 1. ________ Hypotheses Stated – 5 pts 2. ________ Level of Significance Stated – 1 pt 3. ________ Assumptions Verified – 5 pts 4. ________ Test Statistic Stated – 2 pts 5. ________ P-value Stated – 3 pts 6. ________ Conclusion – 4 pts 7. ________ Interpretation clearly stated in context of the problem. – 5 pts 8. ________ Minitab output in Word document (5 pts) Problem 2 Part a) 9. ________ Part a) – 5 pts Part b) 10. ________ Hypotheses Stated – 5 pts 11. ________ Level of Significance Stated – 1 pt 12. ________ Assumptions Verified – 5 pts 13. ________ Test Statistic Stated – 2 pts 14. ________ P-value Stated – 3 pts 15. ________ Conclusion – 4 pts 16. ________ Interpretation clearly stated in context of the problem. – 5 pts 17. ________ Minitab output in Word document – 5 pts Part c) 18. ________ Standardized Residual Analysis – 10 pts 19. ________ Deductions 20. ________ Total Score (out of 85) Attach your completed CA 3 under the appropriate assignment in the assignments section of BB. You will not receive full credit if that is not appropriately attached. STA 320 Smith CA #3 – Chapter 13 - using Minitab Name: 1. When public opinion surveys are conducted by mail, a cover letter explaining the purpose of the survey is usually included. To determine whether the wording of the cover letter influences the response rate, three different cover letters were used in a survey of students at a Midwestern university. Suppose that each of the three cover letters accompanied questionnaires sent to an equal number of randomly selected students. Returned questionnaires were then classified according to the type of cover letter (I, II, or III). Use the accompanying data to test the hypothesis that the true proportions of all returned questionnaires accompanied by cover letters I, II, and III are the same. Use a 0.05 significance level. Cover-letter Type I II III Frequency 49 41 37 Step 1 The null and alternate hypotheses are The variable has the specified distribution. (The true proportions of all returned questionnaires accompanied by cover letters I, II, and III are the same.) The variable does not have the specified distribution. (The true proportions of all returned questionnaires accompanied by cover letters I, II, and III are not the same.) The test is a right-tailed test. Step 2 The selected level of significance, α is 0.05. The selected test is the Chi-Square Goodness-Of-Fit Test. The equation of the test statistic is given by: With df = c – 1 Where The assumptions of the test are that 1) All expected frequencies are 1 or greater, 2) At most 20% of the expected frequencies are less than 5, and 3) the sample is a simple random sample. As shown in Minitab output, all expected frequencies are greater than 1 and no expected frequency is less than 5. Furthermore, as stated in the problem, the sample is a simple random sample. Therefore, all the assumptions of the test are met. Step 3 The test statistic is (df = 2, N = 127) = 1.764 Step 4 The P-value is P = 0.414 Step 5 Conclusion (If P ≤ α, reject H0; otherwise, do not reject H0.) From step 4, P = 0.414. Because the P-value is greater than the specified significance level of 0.05, we fail to reject H0. The test results are not statistically significant at the 5% level. Step 6 Interpretation At the 5% significance level, the data provide sufficient evidence to conclude that the hypothesis that the true proportions of all returned questionnaires accompanied by cover letters I, II, and III are the same. Minitab Output 2. A survey was conducted in the San Francisco Bay area in which each participating individual was classified according to the type of vehicle used most often and city of residence. A subset of the resulting data is given in the accompanying table. Do the data provide convincing evidence of an association between city of residence and vehicle type? Use a significance level of 0.05. You may assume that it is reasonable to regard the sample as a random sample of Bay area residents. Vehicle Type City Concord Pleasant Hills North San Francisco Small 68 83 221 Compact 63 63 104 Midsize 88 123 142 Large 24 18 11 a. Is this a test of homogeneity or a test of independence? It is a test of independence, as we want to test if there is an association between city of residence and vehicle type. b. Test the relevant hypotheses using a significance level of 0.05. Step 1 The null and alternate hypotheses are There is no association between city of residence and vehicle type. There is an association between city of residence and vehicle type. The test is a right-tailed test. Step 2 The selected level of significance, α is 0.05. The selected test is the Chi-Square Independence Test. The equation of the test statistic is given by: With df = (r – 1) (c – 1) Where The assumptions of the test are that 1) All expected frequencies are 1 or greater, 2) At most 20% of the expected frequencies are less than 5, and 3) the sample is a simple random sample. As shown in Minitab output, all expected frequencies are greater than 1 and no expected frequency is less than 5. Furthermore, as stated in the problem, it is reasonable to regard the sample as a random sample of Bay area residents. Therefore, all the assumptions of the test are met. Step 3 The test statistic is (df = 6, N = 1008) = 50.18 Step 4 The P-value is P < 0.001 Step 5 Conclusion (If P ≤ α, reject H0; otherwise, do not reject H0.) From step 4, P < 0.001. Because the P-value is less than the specified significance level of 0.05, we reject H0. The test results are statistically significant at the 5% level. Step 6 Interpretation At the 5% significance level, the data provide convincing evidence of an association between city of residence and vehicle type. Minitab Output c. If applicable, examine the standardized residuals to examine the nature of the evidence about the association. Standardized residuals greater than 2 in absolute value provide evidence against independence in that cell. The value of standardized residuals for Small vehicle type for all the three cities and for Large vehicle type for the city North San Francisco is negative and the absolute value is greater than 2. This suggests that the observed frequency of Small vehicle type all the three cities and for Large Vehicle type for the city North San Francisco is smaller than the expected frequency. In other words, Small vehicle type is not preferred vehicle type in all the three cities and Large vehicle type is not preferred vehicle type in the city North San Francisco. Furthermore, the value of standardized residuals for Large vehicle type for the city Concord and for Midsize vehicle type for the city Pleasant Hills is positive and the absolute value is greater than 2. This suggests that the observed frequency of Large vehicle type for the city Concord, and for Midsize vehicle type for the city Pleasant Hills is greater than the expected frequency. In other words, Large vehicle type is the preferred vehicle type for cities Concord and Midsize vehicle type is the preferred vehicle type for the city Pleasant Hills. However, there is as such no preference for Compact vehicle type across the three cities, as all the standardized residuals absolute values are less than 2 for Compact vehicle type across the three cities. Read More
Cite this document
  • APA
  • MLA
  • CHICAGO
(“Minitab Assignment Example | Topics and Well Written Essays - 250 words - 1”, n.d.)
Retrieved from https://studentshare.org/statistics/1682611-minitab
(Minitab Assignment Example | Topics and Well Written Essays - 250 Words - 1)
https://studentshare.org/statistics/1682611-minitab.
“Minitab Assignment Example | Topics and Well Written Essays - 250 Words - 1”, n.d. https://studentshare.org/statistics/1682611-minitab.
  • Cited: 0 times

CHECK THESE SAMPLES OF Using Statistical Software Package

Comparison of Two Control Chart Commercial Packages

You can use it together with QI Macros as an added package for Microsoft Excel, therefore, becoming easier to draw diagrams and charts.... Professor: PART 1: Comparison of two control chart commercial packages : The packages for analysis are QI Macros and Sigma XL and the followings are the advantages of using QI Macros (Arthur, 26), The software doesn't require a professional who has the knowledge of drawing control charts using excel in its application since it takes a few minute to come up with a diagram....
3 Pages (750 words) Term Paper

Locus of Control and Self-esteem

The main purpose of the research is to study the relationship between locus of control and self-esteem among students studying at Marshall Graduate College, Charleston.... The study aims to investigate whether students having a higher locus of control have low self-esteem and vice versa.... .... ...
8 Pages (2000 words) Research Paper

What Is the Statistical Package for the Social Sciences

The present paper "What Is the Statistical package for the Social Sciences?... SPSS is basically an abbreviation of statistical package for the social sciences.... has identified that there are various functions of SPSS statistics software.... SPSS Statistics is the most widely operated data analysis software in the world.... The use of this software has helped the discipline of research and development to undertake effective studies using SPSS statistical analysis....
1 Pages (250 words) Essay

Observation of Pre-school Children in a Strange Situation

This involves the conversion of immeasurable behavioral qualities into measurable quantities for the purpose of statistical analysis.... he designs of analysis pave way for three fundamental techniques, descriptive statically summary and linear correlation analysis, using the readily available dataset....
8 Pages (2000 words) Lab Report

BUSINESS ANALYTICS METHOD AND SOFTWARE

Over the past two decades, the world of data mining and analytics has been revolutionized due to the advances in statistical software for the targeted discovery of patterns and knowledge from large amounts of data.... This report aims to explore the utility of statistical software such as R and gain insights into the statistical methods such as multivariate analysis of variance (MANOVA) with as well as without regard to each other.... The report will provide with a comprehensive overview of the R software, its advantages and disadvantages, current market trends in the software category and reflect hands-on experience gained by its use....
20 Pages (5000 words) Coursework

French Consumer Price Index for All Goods and Services

This paper, French Consumer Price Index for All Goods and Services, declares that the inflation in France is based on the change in prices of a standard package of goods and services consumed by the French population.... rdinal variables are those variables where the order is important for instance in our data file the question on hardness to learn database management package is ordinal, it has values 1>>>>9 where one indicates easy while 9 indicates hardness....
7 Pages (1750 words) Assignment

Ethics in Computer Software Design and Development

Unfortunately, most software developers are given a small window and compressed budget to release a quality software package, this pressure hinders the goal of achieving a bug-free product at a low cost and on time (Forester & Morrison, 2001, pp.... (2010) defined piracy as, illegal copying of a software package.... When a company uses a pirated software package, then it violates the software license.... The paper "Ethics in Computer software Design and Development" discusses that every progress in IT is attached to at least one ethical uncertainty....
6 Pages (1500 words) Essay
sponsored ads
We use cookies to create the best experience for you. Keep on browsing if you are OK with that, or find out how to manage cookies.
Contact Us