StudentShare
Contact Us
Sign In / Sign Up for FREE
Search
Go to advanced search...
Free

Capital Budgeting and Comparisons of Its Three Alternatives - Assignment Example

Cite this document
Summary
"Capital Budgeting and Comparisons of Its Three Alternatives " show to us the importance the capital budgeting tools like net present value and cash flows. Evidently, all three alternatives are feasible. For, the company has been generating increasing sales for the last five years.  …
Download full paper File format: .doc, available for editing
GRAB THE BEST PAPER97% of users find it useful
Capital Budgeting and Comparisons of Its Three Alternatives
Read Text Preview

Extract of sample "Capital Budgeting and Comparisons of Its Three Alternatives"

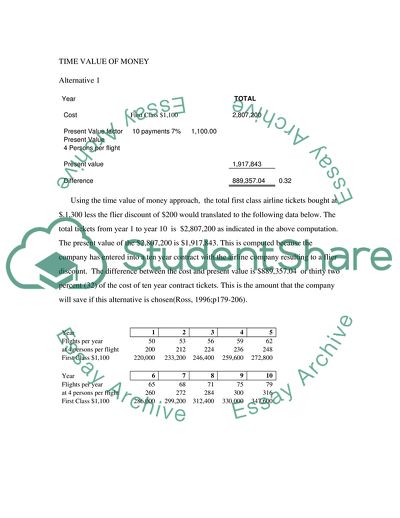
Capital Budgeting INTRODUCTION Capital budgeting is needed when “almost all firms recognize that they face major uncertainties about the future,yet most firms strategic investment decisions are primarily based on a single projection of future events. Although managers do recognize that the failure to include a consideration of uncertainty can lead to costly errors, the difficulty of such planning leads many to ignore the potential costs and hope that serious problems will not arise.”(Trigeoris, 1995; p 31) Thus, companies may need to make strategic decisions on whether to buy a new building, a new equipment, to extend the building a few floor up, or even to make major repairs on its buildings and factory sites. Also, capital investment involves both stock investments and bond contracts. Bond contracts are loans to creditors that are usually paid in monthly or quarterly installments. It is stated that “What do accounting specialists mean when they talk about liquidity and illiquidity? How should responsible business managers use these concepts? Is there a connection between them, and if so, what is this connection? Each of the two pairs of concepts is complementary--each pair forms a whole. And when we search for scientifically viable definitions of these basic concepts, we discover that a debtor who is illiquid is a debtor who is temporarily unable to pay his or her debts, whereas the insolvent debtor is permanently unable to pay his or her debts. Time is thus an element in these definitions, and time is also necessary in order to distinguish between the concepts. A problem of invisibility arises with regard to solvency/insolvency because the solvency or insolvency of business enterprises is not apparent in traditional financial statements, even though such state ments claim to give a "true and fair view." Consequently, traditional financial statements are worthless as a means of describing the financial position of business enterprises.”(Kirdegaard, 1997, p.39) Question 1. The comparisons of the three alternatives are TIME VALUE OF MONEY Alternative 1 Year TOTAL Cost First Class $1,100 2,807,200 Present Value factor 10 payments 7% 1,100.00 Present Value 4 Persons per flight Present value 1,917,843 Difference 889,357.04 0.32 Using the time value of money approach, the total first class airline tickets bought at $.1,300 less the flier discount of $200 would translated to the following data below. The total tickets from year 1 to year 10 is $2,807,200 as indicated in the above computation. The present value of the $2,807,200 is $1,917,843. This is computed because the company has entered into a ten year contract with the airline company resulting to a flier discount. The difference between the cost and present value is $889,357.04 or thirty two percent (32) of the cost of ten year contract tickets. This is the amount that the company will save if this alternative is chosen(Ross, 1996;p179-206). Year 1 2 3 4 5 Flights per year 50 53 56 59 62 at 4 persons per flight 200 212 224 236 248 First Class $1,100 220,000 233,200 246,400 259,600 272,800 Year 6 7 8 9 10 Flights per year 65 68 71 75 79 at 4 persons per flight 260 272 284 300 316 First Class $1,100 286,000 299,200 312,400 330,000 347,600 Alternative 2 PV factor Cost 2,500,000.00 Present Value 10 payments 14% 250,000 x 5.2161 = 1,304,025.00 Present Value 325,000 x 0.2697 (87,652.50) Difference 1,195,975.00 0.48 Using the time value of money approach, the present value of the ten year installment payments amounting to $250,000 is $ 1,304,025. Also, the present value of the scrap value when the airplane will lose its flying use and will be sold is $ 87,652.50 which is deducted from the present value of the airplane purchase. The difference between the cost and the present value where the $2,500,000 is paid in ten equal annual installments is $1,195,975. This can be presented as forty eight percent (48%)of the cost. This is the amount that the company will save if this alternative is chosen. Alternative 3 PV factor Cost on Year 1 650,000.00 10 payments 10% 65,000 x 3.7908 = 246,402.00 Scrap 20% of $650,000 130,000 x 0.6209 (80,717.00) 165,685.00 484,315.00 0.75 Using the time value of money approach, the present value of the ten year installment payments amounting to $65,000 is $ 246,402. Also, the present value of the scrap value at the end of the contract on the tenth year is $ 80,717 which is deducted from the present value of the twenty five percent share contract on the fifth year. The difference between the cost and the present value where the $650,000 is paid in ten equal annual installments is $ 65,000. This can be presented as forty seventy five (75%)of the cost. This is the amount that the company will save if this alternative is chosen. Year onYear 6 TOTAL Cost 650,000 Present Value Factor Present Value 5 payments 10% 130000 x 289,016 Present Value 130,000 x 0.3855 (50,115) 238,901 411,099 0.63 Using the time value of money approach, the present value of the five year installment payments amounting to $130,000 is $ 238,901. Also, the present value of the scrap value at the end of the contract on the tenth year is $ 50,115 which is deducted from the present value of the twenty five percent share contract on the tenth. The difference between the cost and the present value where the $650,000 is paid in five equal annual installments is $ 411,099. This can be presented as sixty three (63%)of the cost. This is the amount that the company will save if this alternative is chosen. Of the three alternatives, the best choice is Alternative B. Based on the above computation, the company will save the largest in terms of expenses if Alternative B is chosen because the savings will amount to the highest at $484,315 for the first five years representing seventy five (75%) and the next savings of $ 411,099 for the sixth to tenth year. This represents sixty three (63%) of the second cost of $650,000. Question 2 Alternative 1 Computer Year Year Year Year Year Hardware 1 2 3 4 5 250000 life 11 years 22727.27 22727.27 22727.27 22727.27 22727.27 Since the $250,000 has been used last year and it is set to expire in the ten year period given in table 2, then the computer hardware will be depreciation over eleven years. The yearly depreciation then is $22,727.27 for the next ten years(Shetty, 1995; p332-334). Alternative 2 Computer Year Year Year Year Year Hardware 1 2 3 4 5 250000 227272.7 0 0 0 0 Since the case states that when the airplane is bought , then this will become obsolete. Thus, the balance ($250,000 less prior year depreciation expense of $ 22,727.27) of $227,272.70 should be immediately written off on the first day of Year 1. Alternative 3 Computer Year Year Year Year Year Hardware 1 2 3 4 5 250000 227272.7 0 0 0 0 Since the case states that when the $650,000 five year contract will be entered into, then the computer hardware bought last year at $250,000 will become obsolete. Thus, the balance ($250,000 less prior year depreciation expense of $ 22,727.27) of $227,272.70 should be immediately written off on the first day of Year 1. The $250,000 investment will not be affected if alternative 1 is chosen. For Alternative 2, the $250,000 will be recorded as a loss in the income statement thereby reducing the net income of the company. In like manner, the loss from the change to this alternative is added back to the income in order to come up with the proper statement of cash flows. Also, for alternative 3, the $250,000 will be recorded as a loss in the income statement thereby reducing the net income of the company. In like manner, the loss from the change to this alternative is added back to the income in order to come up with the proper statement of cash flows. Question 4 Year 1 2 3 4 5 Flights 50 53 56 59 62 at 4 travellers per flight 200 212 224 236 248 lost hours per flight 4 4 4 4 4 Total lost hours 800 848 896 944 992 multiply by hourly rate 100 100 100 100 100 Tota salary lost 80000 84800 89600 94400 99200 Based on the above data, the total salary lost because of flight delays are increasing from the $80,000 on year 1 to $99,200 on year 5. This is because there are four hours lost in each flight and there are four travelers per flight. Year 6 7 8 9 10 Flights per year 65 68 71 75 79 at 4 persons per flight 260 272 284 300 316 Multiply by hourly rate 4 4 4 4 4 Total salary lost 1040 1088 1136 1200 1264 Multiply by hourly rate 100 100 100 100 100 Total salary lost 104000 108800 113600 120000 126400 Based on the above data, the total salary lost because of flight delays are increasing from the $104,000 on year 6 to $126,400 on year 10. This is because there are four hours lost in each flight and there are four travelers per flight. Annual salary 208,000 Divide to get weekly 52 4000 Divide to get hour rate 40 Salary per hour 100 The above computation shows how the hourly rate was mathematically computed using 52 weeks in one year and a 40 hours in one week. The result is $100 per flight hour. Question 5 2500,000 - 325,000 = Depreciation Expense 10 years 217500 = Under Alternative 2, the depreciation expense for the airplane is $217,500 per year for the ten year period under study. Also, the $250,000 hardware will be depreciated here as explained by the above paragraph. Year 1 2 3 4 5 Depreciation Expense - Airplane $ 2.5M 217,500 217,500 217,500 217,500 217,500 Depreciation Expense - Hardware $250,000 227273 0 0 0 0 Total depreciation for tax purposes 444,774 217,502 217,503 217,504 217,505 Year 6 7 8 9 10 Depreciation Expense - Airplane $ 2.5M 217,500 217,500 217,500 217,500 217,500 Depreciation Expense - Hardware $250,000 0 0 0 0 0 Total depreciation for tax purposes 217506 217507 217508 217509 217510 Alternative 3 The depreciation expense is computed by dividing the $ 650,000 by five years. The salvage value is twenty percent ( .20) of the cost $650,000. There are two $650,000 loans occurring within the ten year period in this study. Also, the $250,000 hardware investment balance after deducting $22,7272.27 from the original cost of $250,000 will deducted on year 1 only because it has been rendered obsolete when alternative 3 is chosen. Year 1 2 3 4 5 Depreciation expense 1st to 5th year 104,000 104,000 104,000 104,000 104,000 Depreciation expense $250,000 hardware 227,272.70 0 0 0 0 total depreciation for tax purposes 331,273.70 104,002 104,003 104,004 104,005 Year 6 7 8 9 10 Depreciation expense 6th to 10th year 104,000 104,000 104,000 104,000 104,000 Depreciation expense $250,000 hardware 0 0 0 0 0 Total depreciation for tax purposes 104006 104007 104008 104009 104010 The annual depreciation is $104,000 which is evenly distributed over five (5) years. Question 6 Yes, the alternatives have different degrees of risks. Meaning, the degrees of risks are affected by the types of customers(Weston, 1993;p..581-620). Alternative Percentage Ratio A 2,807,200 0.07 196,504.00 0.29 B 2,500,000 0.14 350,000.00 0.52 C 1,300,000 0.10 130,000.00 0.19 0.31 676,504.00 1.00 Alternative A amounting to $2,807,200 is the total of first class tickets amounting to $1,100 for the entire ten year period. Also, the Alternative A is multiplied by its after risk adjusted cost of capital to come up with the amount of $196,504. This is equal to twenty nine percent of the entire three alternatives. And, alternative B is multiplied by its risk adjusted cost of capital of fourteen percent to come up with the amount of $350,000. This represents fifty two risk ratio. Lastly, the two $650,000 twenty five percent airplane share that will be taken within the ten year period will be multiplied by ten percent to generate $130,000. This is equal to nineteen percent of the entire alternative choices. Thus, the best choice in terms of risk is choice C for it has the lowest risk ratio of only nineteen percent. Question 7 Alternative 1 Before inflation Year 1 2 3 4 5 Flights per year 50 53 56 59 62 at 4 persons per flight 200 212 224 236 248 First Class $ 1,100 220,000 233,200 246,400 259,600 272,800 Year 6 7 8 9 10 Flights per year 65 68 71 75 79 at 4 persons per flight 260 272 284 300 316 First Class $ 1,100 286,000 299,200 312,400 330,000 347,600 After 6% inflation Year 1 2 3 4 5 Flights per year 50 53 56 59 62 at 4 persons per flight 200 212 224 236 248 Plane ticket $1,166 233,200 247,192 261,184 275,176 289,168 Increase 13,200 13,992 14,784 15,576 16,368 Year 6 7 8 9 10 Flights per year 65 68 71 75 79 at 4 persons per flight 260 272 284 300 316 Plane ticket $1,166 303,160 317,152 331,144 349,800 368,456 Increase 17,160 17,952 18,744 19,800 20,856 Based on the above computation, the six percent inflation rate has caused an increase in ticket prices on the first year of $13,200, $13,992 on the second year, $ 14,784 on the third year, $15,576 on the fourth year, $ 16,368 on the fifth year. Further, the six percent inflation rate has cause an increase in ticket costs of $17,160 for the 6th year, $ 17,952 on the 7th year, $18,744 on the 8th year, $19,800 on the 9th year and finally an increase of $ 20,856 on the tenth or last year in this study . Alternative 2 Before inflation 200 212 224 236 248 Year 1 2 3 4 5 Fuel 400 80,000 84,800 89,600 94,400 99,200 Crew 250 50,000 53,000 56,000 59,000 62,000 Maintenance 167 33,400 35,404 37,408 39,412 41,416 Total Variable cost 380,900 390,704 400,508 410,312 420,116 Fixed Cost 204,528 204,528 204,528 204,528 204,528 Total cost 585,428 595,232 605,036 614,840 624,644 Before inflation, the total cost for year 1 is $ 585,428, year 2 is $ 595,232, year 3, $ 605,036, Year 4 $614,840 and year 5 $ 624,644 . Before inflation 260 272 284 300 316 Year 6 7 8 9 10 Fuel 400 104,000 108,800 113,600 120,000 126,400 Crew 250 65,000 68,000 71,000 75,000 79,000 Maintenance 167 43,420 45,424 47,428 50,100 52,772 Total Variable cost 212,420 222,224 232,028 245,100 258,172 Fixed Cost 204,528 204,528 204,528 204,528 204,528 Total cost 416,948 426,752 436,556 449,628 462,700 Before inflation, the total cost amounted to the following: Year 6,$416,948 and $426,752 for the seventh year, $436,556 for the eighth year, $449,628 for the ninth year and lastly $ 462,700. After inflation Year 1 2 3 4 5 Fuel 432 86,400 91,584 96,768 101,952 107,136 Crew 270 54,000 57,240 60,480 63,720 66,960 Maintenance 175.35 35,070 37,174 39,278 41,383 43,487 Total Variable cost 392,970 403,498 414,026 424,555 435,083 Fixed Cost 8% 220,890 220,890 220,890 220,890 220,890 Total cost 613,860 624,388 634,917 645,445 655,973 Increase 28,432 29,156 29,881 30,605 31,329 After inflation, the total cost amounted to the following: Year 1 $ 613,860, Year 2 $ 624,388, year 3, $634,917, year 4 $645,445 and lastly $655,973. There is an increase in costs in the amounts of $ 28,432 for year 1, $29,156 in year 2, $ 29,156, year 3, $29,881,year 4 $30,605 and lastly, $31,329. After inflation Year 6 7 8 9 10 Fuel 432 112,320 117,504 122,688 129,600 136,512 Crew 270 70,200 73,440 76,680 81,000 85,320 Maintenance 175.35 45,591 47,695 49,799 52,605 55,411 Total Variable cost 228,111 238,639 249,167 263,205 277,243 Fixed Cost 8% 220,890 220,890 220,890 220,890 220,890 Total cost 449,001 459,529 470,058 484,095 498,133 Increase 32,053 32,777 33,502 34,467 35,433 After inflation, the total cost amounted to the following: Year 6 $449,001, year 7 $459,529, year 8 $470,058, year 9 $484,095 and lastly $ 498,133 on the tenth year. There is an increase on total cost by: year 1 $28,432, year 2 $29,156, year 3 $29,881, year 4 $ 30,605 and lastly year 5 $31,329. Also, the increase in total cost amounted to: $32,053 on year 6, $32,777 on year seven, $33,502 on year 8, $ 34,467 on year 9 and lastly $ 35,433 was chosen. Thus inflation increases the variable costs as well as the total costs of investments. Thus, inflation is one of the many reasons people are forced to work harder and faster. Alternative 3 Before Inflation Year 1 2 3 4 5 200 212 224 236 248 $1,060 212,000.00 224,720.00 237,440.00 250,160.00 262,880.00 Fixed Cost 139,963.20 139,963.20 139,963.20 139,963.20 139,963.20 Total cost 351,963.20 364,683.20 377,403.20 390,123.20 402,843.20 The total cost under alternative 3 are: $ 351,963 for year 1, $ 364,683.20 for year 2, $377,403.20 for year 3, $ 390,123.20 for year 4 and $402,843.20 for year 5. Before Inflation Year 6 7 8 9 10 260 272 284 300 316 $1,060 275,600.00 288,320.00 301,040.00 318,000.00 334,960.00 Fixed Cost 139,963.20 139,963.20 139,963.20 139,963.20 139,963.20 Total cost 415,563.20 428,283.20 441,003.20 457,963.20 474,923.20 The total cost under alternative 3 are $ 415,563.20 for year 6, $428,283.20 for year 7, $441,003.20 for year 8, $ 457,963.20 for year 9 and $ 474,923.20 for year ten. After inflation Year 1 2 3 4 5 200 212 224 236 248 Ticket (1.06%) 224,720.00 238,203.20 251,686.40 265,169.60 278,652.80 Fixed Cost (1.04%) 145,561.73 145,561.73 145,561.73 145,561.73 145,561.73 Total Cost 370,281.73 383,764.93 397,248.13 410,731.33 424,214.53 Increase 18,318.53 19,081.73 19,844.93 20,608.13 21,371.33 After the inflation rate of six percent (.06) is applied to the ticket costs and the four percent (.04) is applied to the fixed costs, the total cost is composed of $18,318.53 for year 1, $383,764.93 for year 2, $397,248.13 for year3, $ 410,731.33 for year 4, $424,214.53 for year 5. There is an increase in total cost amounting to $18,318.53 for year 1, $19,081.71 for year 2, $19,844.93 for year 3, $ 20,608.13 for year 4 and $21,371.33 for year five. After inflation Year 6 7 8 9 10 260 272 284 300 316 Ticket (1.06%) 292,136.00 305,619.20 319,102.40 337,080.00 355,057.60 Fixed Cost (1.04%) 145,561.73 145,561.73 145,561.73 145,561.73 145,561.73 Total Cost 437,697.73 451,180.93 464,664.13 482,641.73 500,619.33 Increase 22,134.53 22,897.73 23,660.93 24,678.53 25,696.13 After the inflation rate of six percent (.06) is applied to the ticket costs and the four percent (.04) is applied to the fixed costs, the total cost is composed of $ 437,697.73 for year 6, $451,180.93 for year 7, $464,664.13 for year 8, $482,641.73 for year 9 and $500,619.33 for year ten. There is an increase in total cost amounting to $22,134.53 for year 6, $22,897.73 for year 7, $23,660.93 for year 8, $24,678.53 for year 9 and $25,696.13 for year 10. Thus, inflation increases the total cost in this situation Question 8 Cess citiation 2 cost 2,500,000 Depreciation expense 2500000-325000 = 217,500 10 years By dividing the difference between the cost of $2,500,000 and the salvage value of $325,00 ten years we can arrive at the depreciation expense of $ 217,500. However, the amount that the company will receive at the end of the ten years in exchange for the airplane to $ 325,000 is the net salvage value.       630000-(+.20*630000)     5 years     Whereas, the net salvage value of the time sharing is 20% of $630,000 which is $126,000. The salvage value is the amount that the company will received at the end of the five year contract. This is the twenty percent that has been computed to be $126,000. Question 9 Alternative 1 After 6% inflation Year 1 2 3 4 5 Flights per year 50 53 56 59 62 at 4 persons per flight 200 212 224 236 248 Plane ticket $1,166 233,200 247,192 261,184 275,176 289,168 Year 6 7 8 9 10 Flights per year 65 68 71 75 79 at 4 persons per flight 260 272 284 300 316 Plane ticket $1,166 303,160 317,152 331,144 349,800 368,456 Just as discussed above, the plane ticket will be discounted so clients will have to pay $200 less per ticket. The plane tickets are recorded at $233,200 for the first year, $247,192 for the second year, $261,184 for the third year, $275,176 for the fourth year and $289,168 for the fifth year. Also, the plane tickets will be recorded at $303,160 for the sixth year, $317,152 for the 7th year, $331,144 for the 8th year, $349,800 for the 9th year and finally it ends at $368,456 for the tenth year. It is but fitting to include the inflation in the computation above. Alternative 2 After inflation Year 1 2 3 4 5 Fuel 432 86,400 91,584 96,768 101,952 107,136 Crew 270 54,000 57,240 60,480 63,720 66,960 Maintenance 175.35 35,070 37,174 39,278 41,383 43,487 Total Variable cost 392,970 403,498 414,026 424,555 435,083 Fixed Cost 8% 220,890 220,890 220,890 220,890 220,890 Total cost 613,860 624,388 634,917 645,445 655,973 Surely, inflation should be included in the computation. The total cost here is $613,860 for the first year, $624,388 for the second year, $634,917 for the 3rd year, $645,445 for the 4th year and $655,973 for the fifth year. The fuel, crew and maintenance costs are computed based on the number of flights and executives boarding each flight ( which is 4 executives per flight). After inflation Year 6 7 8 9 10 Fuel 432 112,320 117,504 122,688 129,600 136,512 Crew 270 70,200 73,440 76,680 81,000 85,320 Maintenance 175.35 45,591 47,695 49,799 52,605 55,411 Total Variable cost 228,111 238,639 249,167 263,205 277,243 Fixed Cost 8% 220,890 220,890 220,890 220,890 220,890 Total cost 449,001 459,529 470,058 484,095 498,133 Furthermore, the total cost for year 6 is $449,001, year 7 is $459,529, year 8 is $470,058, $220,890 for year 9 and finally $498,133 for year 10 above. Thus, inflation rate must be used to show a more realistic variable and fixed costs here. Alternative 3 After inflation Year 1 2 3 4 5 200 212 224 236 248 Ticket (1.06%) 224,720.00 238,203.20 251,686.40 265,169.60 278,652.80 Fixed Cost (1.04%) 145,561.73 145,561.73 145,561.73 145,561.73 145,561.73 Total Cost 370,281.73 383,764.93 397,248.13 410,731.33 424,214.53 Increase 18,318.53 19,081.73 19,844.93 20,608.13 21,371.33 After inflation Year 6 7 8 9 10 260 272 284 300 316 Ticket (1.06%) 292,136.00 305,619.20 319,102.40 337,080.00 355,057.60 Fixed Cost (1.04%) 145,561.73 145,561.73 145,561.73 145,561.73 145,561.73 Total Cost 437,697.73 451,180.93 464,664.13 482,641.73 500,619.33 Question 10 We should focus on after –tax cash flows. For, this shows that the company is paying the taxes due the government. Assuming cash flows before tax gives an impression that the company will try to set to a later date, the overdue taxes due the government of the U.K. Logically, the after tax cash flow is more realistic because the company is only allowed to use cash that is not earmarked for tax payments(Weston, 1981;p66-87). To illustrate, under alternative 2, year 1 and year 2 are computed twice. First, column A and B below shows cash flows computed after net income taxes whereas column C an D below shows the cash flow computations before income taxes. It is very obvious that cash flows after taxes is the proper way to do it. This is explained in the prior paragraph. After inflation A B C D Assume sales 5,000,000 5,000,000 5,000,000 5,000,000 Year 1 2 1 2 Depreciation Expense 217500 217500 217500 217500 Depreciation Expense 227,272.70 227272.7 0 Fuel 432 86,400 91,584 86400 91584 Crew 270 54,000 57,240 54000 57240 Maintenance 175.35 35,070 37,174 35070 37174 Total Variable cost 620,243 403,498 620,243 403,498 Fixed Cost 8% 220,890 220,890 220,890 220,890 Total cost 399,353 624,388 399,353 182,608 Net income before tax 4,600,647 4,375,612 4,600,647 4,375,612 Tax 40% 1,840,259 1,750,245     Net income after tax 2,760,388 2,625,367 Depreciation Expense 217,500.00 217500 Depreciation Expense 227,272.70 Cash flows 3,205,161 2,842,867     The brown colored numbers are the cash flows using before tax and after tax cash flows. Question 11 Naturally, cash inflows less cash outflows is equal the cash balance as indicated in the balance sheet for the year in study. Also, cash inflows comes from sales. Meaning, if there are more sales, then it corresponds to more income. More income normally translates to more cash availability. Since the company has been doing increasing its sales and profits for the past five years, then it automatically translates to more cash inflows. More cash inflows translates to more cash on hand at the balance sheet date(Jafee, 1996;p.22-30). However, if the company has been generating losses for the past five years, then there is no difference in amount between cash inflows computed after taxes or cash inflows before taxes. Losses occur if sales are less than the total operating expenses of the company. Thus, losses normally result to lesser cash inflows. Lesser cash inflows will result to lesser cash in the balance sheet date generated from the normal business operations. The business operations could generate sales from sales of services or sales of products. Question 12 Replacement chains Asset 0 1 2 3 4 5 6 Both equal X -6000 2600 2600 -3400 2600 2600 2600 3600 Y -4000 2600 -1400 2600 -1400 2600 2600 3600 Where: NPVx (2%) =$2909.79. NPVy(2%) =$3023.666. We should pic Y for it has the higher net present value . Thus based on the above example, the constant chain of replacement in perpetuity can be very useful in this case in order to evaluate the three travel alternatives. For, the net present value of investments can be computed using the net present value tables. This is definitely different from the annual equivalent cost(Brigham, 1985;p 307-380). Question 13 Yes, Mike Cramer’s assessment of risk level of each travel alternative is sufficient justification for the financial analysts to apply different discount rates to each of the three travel alternatives. Reiterating from question no. 6 above, Alternative Percentage Ratio A 2,807,200 0.07 196,504.00 0.29 B 2,500,000 0.14 350,000.00 0.52 C 1,300,000 0.10 130,000.00 0.19 0.31 676,504.00 1.00 Of the three alternatives above, the best choice in terms of risk is choice C for it has the lowest risk ratio of only nineteen percent. For the lower, the risk, the better the company. Question 14 Mike Cramer should choose the work that he is capable of accomplishing. Based on the above analysis, Only one of the three alternatives can be chosen because the company has to maximize profits just like the past five years and it is forecasted that the company will continue to increase their profits until ten years in the future starting with Year 1 in this study. The best choice is alternative C as explained in question 1 above . To reiterate from question no. 1 above, of the three alternatives, the best choice is Alternative B. Based on the above computation, the company will save the largest in terms of expenses if Alternative B is chosen because the savings will amount to the highest at $484,315 for the first five years representing seventy five (75%) and the next savings of $ 411,099 for the sixth to tenth year. This represents sixty three (63%) of the second cost of $650,000. CONCLUSION Forecasting using the cash flows and the net present value is a necessary tool in order to prevent what happened to Barings bank of London. Lance Davis stated that “ No one believes that history repeats itself exactly, but many economic historians must have nodded knowingly when they opened their morning newspapers on February 27, 1995. On that day newspapers throughout the world reported that the House of Baring — one of the worlds oldest private banks — had gone into bankruptcy. Over one hundred years earlier, in 1890, Barings had also teetered on the verge of bankruptcy. The cases are remarkably similar. Not only did the two crises involve the same institution, but in both cases Barings was involved in financial operations in the less—developed world. In 1890 it was Latin America, particularly Argentina and Uruguay.”(Davis, 2001, p 1) Thus, the above discussions will show to us the importance the capital budgeting tools like net present value and cash flows. Evidently, all three alternatives are feasible. For, the company has been generating increasing sales for the last five years. However, buying an airplane entails large sums of money in the tune of $2,500,000. Whereas, the $650,000 investment only allows only a 25 percent ownership of one plane. Of all the alternatives, alternative 1 needs the lowest amount of capital budgeting. Thus, whichever alternative Mike chooses will be good for the company because the end of all these alternatives is to increase air travel because face to face marketing management is a good strategic management idea. In conclusion, we have to choose alternative no. 3 based on the above discussions on the three vying alternatives. REFERENCES: Ross, et al., 1996, Essentials of Corporate Finance, Sydney, Irwin Press, p179-206 Shetty et al., 1995, Finance An Integrated Global Approach, Sydney, Irwin Press, p 332- 334. Weston, F., Brigham, E., 1993, Essentials of Managerial Finance, Sydney, Dryden Press, p..581-620 Brigham, E., Gapenski, L., 1985, Financial Management, Sydney, Dryden Press,p 307- 380 Jafee et al., 1996, Corporate Finance, Sydney, Irwin Press, p.22-30. Weston, F., Brigham, E., 1981, Managerial Finance, Sydney, Dryden Press, p 66-87) Trigeorgis, L., 1995, Real Options in Capital Investment: Models, Strategies, and Applications London, Praeger Publishers, 1995, p. 31. Kirdegaard, H., 1997, Improving Accounting Reliability: Solvency, Insolvency, and Future Cash Flows, London, Quorum Books, 1997, P. 39. Davis, L., Gallman, R., 2001, Evolving Financial Markets and International Capital Flows: Britain, the Americas, and Australia, 1865-1914, Cambridge University Press, Cambridge, England, P. 1. Read More
Cite this document
  • APA
  • MLA
  • CHICAGO
(Capital Budgeting and Comparisons of Its Three Alternatives Assignment, n.d.)
Capital Budgeting and Comparisons of Its Three Alternatives Assignment. https://studentshare.org/finance-accounting/1708536-corporate-finance
(Capital Budgeting and Comparisons of Its Three Alternatives Assignment)
Capital Budgeting and Comparisons of Its Three Alternatives Assignment. https://studentshare.org/finance-accounting/1708536-corporate-finance.
“Capital Budgeting and Comparisons of Its Three Alternatives Assignment”. https://studentshare.org/finance-accounting/1708536-corporate-finance.
  • Cited: 0 times

CHECK THESE SAMPLES OF Capital Budgeting and Comparisons of Its Three Alternatives

BTA Machine & Tools Appraisal of a Capital Expenditure Project

It is also important to undertake a subjective evaluation of each of the projects, in terms of its suitability for the macro-environment.... Incremental analysis includes only the financial data that would vary in the future as a result of adopting each of the possible alternatives; all current data that are foreseen to remain unchanged are not included in the analysis (Weygandt, Kimmel & Kieso, 2010, p.... In order to bolster production to meet the new demand, three alternative projects are being contemplated which are intended to replace the currently outdated technology and increase production capacity....
8 Pages (2000 words) Essay

Accounting Evaluation And Forecast

According to Carter & Usry, activities of an organization can be divided to three large groups, which are Planning, Organizing and Controlling.... hellip; According to Carter & Usry, activities of an organization can be divided to three large groups, which are Planning, Organizing and Controlling.... The sales/operating assets ratios present a slight lead on Aberdare's effectiveness on using its operating assets to produce sale, while the interest cover ratio display Aberdare's better performance on taking advantage of debts to finance operations....
9 Pages (2250 words) Essay

Nucleons Stocks in the Stock Market

The paper “Nucleon's Stocks in the Stock Market” explains why the pilot in-house capital budgeting is the best investment choice in this case study.... The following paragraphs explain why the pilot in-house capital budgeting is the best investment choice in this case study(Louderback, 326).... This is the best choice of the three possible alternatives.... This is the best choice of the three possible alternatives....
5 Pages (1250 words) Essay

Financial Analysis of two companies- Iggle and Piggle

n the corporate world, the main aim on which the management focuses in terms of managing its finances is by achieving various goals that are set for a particular period.... There are particular financial processes which should be followed by a firm to fulfill its profit-making objectives.... he company Iggle plc had a return on capital employed of 35% with the return on equity of 20% which is determined by the ratio of net income to the total equity of the company....
14 Pages (3500 words) Essay

Analyze Capital Budgeting Methodologies (NPV, IRR, MIRR, etc..)

This process is carried out to invest the limited finances of the business in any project that would generate maximum return for the… As the resources of the business are limited, it is necessary to ration or budget those resources so that beneficial returns is earned from them (Maps of World, 2012). There are various techniques of capital budgeting some based on the concept cash flow from the Some of the major capital budgeting techniques are: 2.... This technique uses discounted cash flows in its analysis, which makes it one of the most accurate capital budgeting techniques....
5 Pages (1250 words) Research Paper

Capital Structure Decision

Short time range bonds such as option three, four and five negatively affects business shareholders, this is because, the business is forced to source for funds and pay the creditors irrespective of whether it has generated profits or not, the bottom line is that the business has a responsibility to repay the funds within the agreed period.... The enterprise's business risk goes up due to its high contribution to the enterprise, in this case, the high contribution of debt such as in option one leads to the debt holders having a high control of the enterprise....
13 Pages (3250 words) Research Paper

Good Investment Opportunities for Lockheed Company

The answer to this query is in the investment analysis and the… The capital budgeting techniques includes Net Present Value method, internal rate of return method and payback period.... The budgeting method used in the cases will help the decision maker in critically analyzing all the available alternatives and choosing the best among them, so that they can achieve profitable cash flows in future.... Every method has its own pros and cons which are used in different scenarios....
10 Pages (2500 words) Essay

The Value of Internal Rate of Return

 Its role in the capital budgeting cannot be overemphasized because of the ease and convenience of its use.... Given the ease of its comparison, it has therefore advantaged over that of other methods like NPV....   As a method in evaluating capital budgeting decisions, its role can only be taken with seriousness since its wrong use could have disastrous consequences as companies make long term commitment to their resources.... This paper "The Value of Internal Rate of Return" discusses IRR as a useful measure of investments if treated with caution may, in fact, be appreciated, given that its wide acceptance in practice....
8 Pages (2000 words) Assignment
sponsored ads
We use cookies to create the best experience for you. Keep on browsing if you are OK with that, or find out how to manage cookies.
Contact Us