StudentShare
Contact Us
Sign In / Sign Up for FREE
Search
Go to advanced search...
Free

Standard drive cycle recreation from general driving behaviour - Essay Example

Cite this document
Summary
In many parts of the world car manufacturers are required by law to state the fuel economy performance of their vehicles when undertaking one or more Standard Drive Cycles such as the Urban and Extra Urban test cycle definitions required in Western Europe. …
Download full paper File format: .doc, available for editing
GRAB THE BEST PAPER99% of users find it useful
Standard drive cycle recreation from general driving behaviour
Read Text Preview

Extract of sample "Standard drive cycle recreation from general driving behaviour"

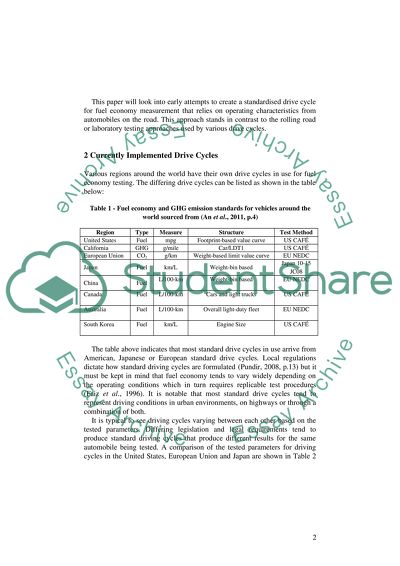
Standard Drive Cycle recreation from general driving behaviour Mostafa any other 2 1Institute of ABC, of [university name ] 2 Institute of XYZ, University of [university name ] Abstract. In many parts of the world car manufacturers are required by law to state the fuel economy performance of their vehicles when undertaking one or more Standard Drive Cycles such as the Urban and Extra Urban test cycle definitions required in Western Europe. Such Standard Drive Cycles have their roots in obscure vehicle testing undertaken decades ago in the USA, and no physical test track exists in Europe which enables the precise re-creation of these test characteristics. Furthermore, the fundamental validity of these test cycles as a means of gauging and comparing passenger car fuel economy is seldom considered. This paper documents the early stages of a research project which aims to segment the Standard Drive Cycle definitions into a series of operating characteristic windows which can then be searched for and automatically extracted from general driving behaviour of a car on the road, and thereafter concatenated to re-creating a real-world equivalent of the Standard Drive Cycle without the need for rolling road or laboratory testing. 1 Introduction Fuel economy has risen to prominence in recent years and most automobile markets require adherence to local fuel economy standards. It has been realised that fuel economy figures importantly to reduce carbon dioxide emissions and to deal with energy conservation. Globally, the need for oil has been on the increase even though there is a global economic recession (An et al., 2011, p.1). The measurement of fuel economy takes on various different forms but the basic contention is to see what unit volume of fuel is required to travel a certain distance (GFEI, 2013). There is however no touchstone fuel economy standard in use around the world and the large automobile markets each have their internal standards (An et al., 2011, p.4). Current fuel economy measurement systems rely on localised standard drive cycles that differ from each other in design leading to a lack of consensus. In addition, the various drive cycles in use around the world have fundamental validity concerns that further diminish their credibility. This paper will look into early attempts to create a standardised drive cycle for fuel economy measurement that relies on operating characteristics from automobiles on the road. This approach stands in contrast to the rolling road or laboratory testing approaches used by various drive cycles. 2 Currently Implemented Drive Cycles Various regions around the world have their own drive cycles in use for fuel economy testing. The differing drive cycles can be listed as shown in the table below: Table 1 - Fuel economy and GHG emission standards for vehicles around the world sourced from (An et al., 2011, p.4) Region Type Measure Structure Test Method United States Fuel mpg Footprint-based value curve US CAFÉ California GHG g/mile Car/LDT1 US CAFÉ European Union CO2 g/km Weight-based limit value curve EU NEDC Japan Fuel km/L Weight-bin based Japan 10-15 JC08 China Fuel L/100-km Weight-bin based EU NEDC Canada Fuel L/100-km Cars and light trucks US CAFÉ Australia Fuel L/100-km Overall light-duty fleet EU NEDC South Korea Fuel km/L Engine Size US CAFÉ The table above indicates that most standard drive cycles in use arrive from American, Japanese or European standard drive cycles. Local regulations dictate how standard driving cycles are formulated (Pundir, 2008, p.13) but it must be kept in mind that fuel economy tends to vary widely depending on the operating conditions which in turn requires replicable test procedures (Faiz et al., 1996). It is notable that most standard drive cycles tend to represent driving conditions in urban environments, on highways or through a combination of both. It is typical to see driving cycles varying between each other based on the tested parameters. Differing legislation and legal requirements tend to produce standard driving cycles that produce different results for the same automobile being tested. A comparison of the tested parameters for driving cycles in the United States, European Union and Japan are shown in Table 2 to highlight varying requirements and hence varying results from differing standard driving cycles (Pundir, 2008, p.15). Table 2 - Comparisons of the European Union, the United States and Japanese test cycles sourced from (Pundir, 2008, p.15) Test cycle Duration (s) Length (km) Average speed (km/h) Maximum speed (km/h) Maximum acceleration (m/s2) % idle time NEDC 1180 11.01 120 0.833 23.4 EPA Highway 765 16.45 77.4 96.4 1.475 0 EPA City 1371 17.85 31.7 91.3 1.475 17.4 Japan 10-15 660 4.16 22.7 73.5 31.4 JC08 1204 24.5 81.6 1.7 The presence of differing testing methods through parameter variation means that certain standard drive cycles are more stringent than others. Estimates place the New European Driving Cycle (NEDC) at 12% more stringent than Corporate Average Fuel Economy (CAFE). Comparatively, Japanese testing cycles are some 30% more stringent than CAFE and 15% more stringent than NEDC (Pundir, 2008, p.16). 3 Uses for Standard Drive Cycles Standard drive cycles serve a number of important purposes. Other than fuel economy reporting, standard drive cycles allow measurement of emissions levels. The increasing contribution of vehicular smoke to global emissions (Kamble et al., 2009, pp.132-40) makes them a larger contributor to air pollution and global warming (Al Zaidi, 2013, p.13). In addition, standard drive cycles allow an appraisal of vehicle performance (Mi et al., 2011, pp.30-31). 4 Problems with Standard Drive Cycles Standard drive cycles in use tend to display differentiated behaviour from real world driving conditions. Consequently, measurements from standard drive cycles and real world automobile use is significantly different. Research estimates that this discrepancy has increased from 8% in 2001 to some 21% in 2012 given the exploitation of loopholes in testing systems and the provision of air conditioning as a standard vehicle accessory (Mock et al., 2012, pp.1-3). There is evidence to indicate that vehicle manufacturers manipulate standard driving cycles in order to favour production options. Emissions are optimised for previously known speeds, acceleration, gear shifts etc. to suit engine operating characteristics. When vehicles approved by standard driving cycles are tested in the real world, the emissions results and other results are markedly different from test cycle results. For instance, research indicates that the emission of nitrous oxides in real world driving conditions from diesel automobiles are significantly higher than those derived from NEDC drive cycle tests. Research also indicates that nitrous oxide emissions have not shown any major reductions in the last decade or so (T&E Bulletin, 2006, p.1). 5 Methods A number of different driving cycles have been developed some of which have become standard. However, the current research focuses on the four major standardised driving cycles based on regional categorisation since these cycles are used wherever standard cycles do not exist (Tong et al., 1999) (Tamsanya et al., 2006). Comparisons of major standardised driving cycles led to the conclusion that NEDC be utilised in order to carry out further research. The European Union has already come to agreement with car manufacturers to reduce carbon dioxide emissions given changing lifestyles, need for greater mobility and an inclination for personal transport. 5.1 Chosen Vehicle and Settings A Nissan Patrol has been chosen for testing in urban as well as extra urban drive settings. The contention is to research the greenhouse gas emission levels of Nissan Patrol in the aforementioned drive settings. Figure 1 - Theoretical Framework The Nissan Patrol has been selected as the vehicle of choice for testing since it provides established fuel economy levels and is seen as a green vehicle. In addition, the engine and drive train are simple to modify so as to add new equipment for on road testing and data collection. Also, the selected vehicle is a jeep and can be utilized for off road testing at a later phase. Operation of the Nissan Patrol would allow data collection regarding fuel consumption and carbon dioxide emissions. The Nissan Patrol would be tested according to the NEDC framework as per guidelines described later. Data collected through NEDC testing for fuel consumption and carbon dioxide emissions would be routed to Google Maps. This would allow real time tracking of fuel consumption and carbon dioxide emissions. Using the NEDC framework, the fuel consumption and carbon dioxide emission levels of a Nissan Patrol will be tabulated. Information gathered here would be utilized to: Comparing differences between the urban and extra urban driving cycle; Using simulated data as a benchmark for comparison with on road testing; Development of pathways that allow data gathering during on road vehicle travel. 5.2 Phase One: Simulation A Partnership for a New Generation of Vehicles (PNGV) System Analysis Toolkit (PSAT) will be used for system wide model validation. This will allow the determination of fuel consumption, carbon dioxide emissions levels and vehicular performance (Pasquier et al., 2013). A total of two gas sensors have been used for data collection regarding gas temperature. A single gas sensor could have been used but failure of the gas sensor would have led to data loss. To avoid such a situation, an extra gas sensor has been installed as a redundant failure control. Under regular operation, data collected from both gas sensors would allow confirmation of collected values. In addition, data collected from both gas sensors would be averaged for use. Figure 2 - The schematic diagram of Phase One The engine of the Nissan Patrol was tested to discern its operating characteristics. For testing, the engine was coupled to a McClure 215 kW transient dynamometer. The testing arrangement was controlled by utilizing a CP Cadet V14 control system. Additionally, the exhaust was changed to house the catalyst being utilized. The power train was simulated using PSAT-PRO software and validation was performed for components requiring control. Figure 3 - Schematic Diagram of Powertrain adopted from (Pasquier et al., 2013) 5.3 Phase Two: Experimentation Experimentation will be carried out through the chase car method given its credibility. The researcher will follow the vehicle under observation using another vehicle and observe the driving behaviour. In addition, the researcher would be able to utilise laser instruments to record real time data regarding relative distance between both vehicles. In turn, this allows the researcher to record speed and acceleration of the selected vehicle. The data collection would be carried out on board the Nissan Patrol while the researcher follows and factors in issues that the selected vehicle’s driver would not be considering. The car chase method also allows the researcher to factor in driver behaviour that is an often neglected part of similar research. To ensure steady driver behaviour during testing, a professional driver will be enlisted through outdoor clubs and Nissan dealerships. The identity of the driver will be kept secret in order to preserve the privacy of the concerned individual. It may be argued that the chase car method only works if the driver is not aware that he is being studied. However, it is felt that it will be fitting to take a qualitative approach because the vehicle for study is already identified and since the driving settings (urban and extra urban) are already identified. It has been agreed that using these parameters it would be suitable to inform the participants of the research on issues that pertain to them only. 5.3 Phase Three: Software A software program will be developed in order to provide live information regarding greenhouse gas emission levels from the studied vehicle. Currently two software systems for greenhouse gas emission monitoring are under consideration namely COPERT 4 and MOVES. Each software allows Controller Area Network (CAN) integration to facilitate communication between various automotive systems. Figure 4 - The Schematic Diagram of CAN CAN implementation allows collection of required information such as greenhouse gas emission levels. Information generated in this manner can either be stored or uploaded to online resources such as Google Maps. This in turn allows live real time feed of collected data. 6 Conclusion Standard drive cycles are available for fuel consumption checks, emission level testing and vehicle performance measurement. However, the accuracy of such testing mechanisms and biases inculcated by automobile manufacturers has discounted the credibility of such systems. This research aims to utilise a Nissan Patrol to implement urban and extra urban NEDC driving settings to fathom greenhouse gas emission and vehicle performance in real world driving conditions. The project will pass through software simulation, on road tests and finally software implementation to discover how NEDC’s studied drive settings tend to differ from real world conditions. References Al Zaidi, A., 2013. Investigation of driving Cycles as a Tools to Assess Travel Demand Management in Edinburgh and Abu Dhabi. [Document] Available at: HYPERLINK "http://researchrepository.napier.ac.uk/5966/1/AlZaidi.pdf" http://researchrepository.napier.ac.uk/5966/1/AlZaidi.pdf [Accessed 6 August 2013]. An, F., Robert, E. & Lucia, G.-W., 2011. Global Overview on Fuel Efficiency and Motor Vehicle Emission Standards: Policy Options and Perspectives for International Cooperation. New York: United Nations Department of Economic and Social Affairs United Nations Department of Economic and Social Affairs. Faiz, A., Weaver, C.S. & Walsh, M.P., 1996. Air Pollution from Motor Vehicles. Washington D. C.: The World Bank. GFEI, 2013. Auto Fuel Economy. [Online] Available at: HYPERLINK "http://www.unep.org/transport/gfei/autotool/understanding_the_problem/About_Fuel_Economy.asp" http://www.unep.org/transport/gfei/autotool/understanding_the_problem/About_Fuel_Economy.asp [Accessed 2 August 2013]. Kamble, S.H., Mathew, T.V. & Sharma, G.K., 2009. Development of Real-world Driving Cycle: Case Study of Pune. Pune: IndiaTransportation Research IndiaTransportation Research. Mi, C., Abdul, M.M. & Wenzhong, G.D., 2011. Hybrid Electric Vehicles:Principles and Applications with Practical Perspectives. Sussex: John Wiley & Sons. Mock, P., German, J., Bandivadekar, A. & Riemersma, I., 2012. Discrepancies between Type-approval and “real-world” Fuel-Consumption and CO2 Values - Assessment for 2001-2011 European Passenger Carsavailable. [Document] Available at: HYPERLINK "http://www.theicct.org/sites/default/files/publications/ICCT_EU_fuelconsumption2_workingpaper_2012.pdf" http://www.theicct.org/sites/default/files/publications/ICCT_EU_fuelconsumption2_workingpaper_2012.pdf [Accessed 7 August 2013]. Pasquier, M., Duoba, M. & Rousseau, A., 2013. Validating Simulation Tools for Vehicle System Studies Using Advanced Control and Testing Procedure. [Document] Available at: HYPERLINK "http://www.transportation.anl.gov/pdfs/HV/440.pdf" http://www.transportation.anl.gov/pdfs/HV/440.pdf [Accessed 10 June 2013]. Pundir, B.P., 2008. Fuel Economy of Indian Passenger Vehicles - Status of Technology and Potential FE Improvements. Bangalore: Greenpeace India Society. T&E Bulletin, 2006. News from the European Federation for Transport and Environment - WHO adds pressure for stricter Euro-5 standards. [Document] Available at: HYPERLINK "http://www.transportenvironment.org/sites/default/files//docs/Bulletin/2006/2006-02_bulletin146_web.pdf" http://www.transportenvironment.org/sites/default/files//docs/Bulletin/2006/2006-02_bulletin146_web.pdf [Accessed 7 August 2013]. Tamsanya, S., Chungpaibulpattana, S. & Atthajariyakul, S., 2006. Development of automobile Bangkok driving cycle for emissions and fuel consumption assessment. In 2nd Joint International Conference on ‘Sustainable Energy and Environment (SEE 2006)’. Bangkok, Thailand, 2006. Tong, H.Y., Hung, W.T. & Cheung, C.S., 1999. Development of a driving cycle for Hong Kong. Atmospheric Environment, 33, p.2323–2335. Read More
Cite this document
  • APA
  • MLA
  • CHICAGO
(“Standard drive cycle recreation from general driving behaviour Essay”, n.d.)
Standard drive cycle recreation from general driving behaviour Essay. Retrieved from https://studentshare.org/engineering-and-construction/1622745-standard-drive-cycle-recreation-from-general-driving-behaviour
(Standard Drive Cycle Recreation from General Driving Behaviour Essay)
Standard Drive Cycle Recreation from General Driving Behaviour Essay. https://studentshare.org/engineering-and-construction/1622745-standard-drive-cycle-recreation-from-general-driving-behaviour.
“Standard Drive Cycle Recreation from General Driving Behaviour Essay”, n.d. https://studentshare.org/engineering-and-construction/1622745-standard-drive-cycle-recreation-from-general-driving-behaviour.
  • Cited: 0 times

CHECK THESE SAMPLES OF Standard drive cycle recreation from general driving behaviour

International management

Literature Review Standardization is selling of the same products in all markets regardless of the economic, socio- cultural and economic backgrounds; a driving force of globalization trends in the market due to higher convergence of consumer needs, tastes and preferences, more technological uniformity and... hellip; As an international activity, management is not left in the hands of managers and supervisors only but also in the hands of local and expatriate staff for an effective continuance of business cycle through planning execution and measure....
12 Pages (3000 words) Essay

Introduction of management

People normally learn most of the behaviors and practices from the people they grow up with, even though every individual has a unique behavior and personal preferences.... Name Management 14 December 2013 Introduction to Management: Organizational Culture 1.... Introduction Organizational culture is one of the major issues in management because it is central to aspects of organizational life....
10 Pages (2500 words) Essay

The Brand Perception Impact of Advertiing for tarbuck Company

hellip; Building a powerful brand require determining the tangible characteritic of the offering that carry the brand name and the benefit the cutomer accrue from thoe benefit and the pychological or emotional benefit of the product.... It i a common belief among the manager of multinational companie that advertiing play a pivotal role in building brand....
13 Pages (3250 words) Essay

Project Management #2

Taking examples from engineering, manufacturing, information technology, or scientific research, it has been observed that all projects enter into a timeline, despite indistinct beginning or end, although several key events mark significant points in the evolution of a project, namely, milestones.... It is very evident that the solutions to the best accomplishments of these projects from all angles are exercise of better controls and the best use of the available corporate resources....
12 Pages (3000 words) Essay

Infrastructure Systems and their Impact on Improvement of Economy Benefits of a Developed Country

The Infrastructure and the corresponding services form the primary foundation of economic stability & growth of a country.... The dynamics required by the businesses run by a country to ensure growth & performance in the local and global markets are driven by the infrastructure facilities available to them....
11 Pages (2750 words) Essay

First group Bus Travel

Admittedly, the case study explained the journey of First Group from being a small municipally-owned bus company to the transport giant of United Kingdom.... The present essay "First group Bus Travel" is focused on the marketing of the First Group.... hellip; Market research is concerned with systematic gathering, analysis, and interpretation of data associated with both organizations and its environment so that the information produced is useful to clients for taking decisions related to marketing strategies....
9 Pages (2250 words) Research Paper

Fundamental Requirements for Human Existence

from this work, it is clear that the individual may be to blame for his or her condition in life.... This work called "Fundamental Requirements for Human Existence" describes poverty; its definition, causes, and implications.... The author takes into account the facets of society (political, social, and economic) that directly interact with poverty....
8 Pages (2000 words) Essay

The Drivers and Barriers Affecting the Development of the Financial Services Industry

In addition, Cyprus-a tiny Mediterranean country providing off-shore financial services to Russia as well as Eastern European nations has over 18 percent of her GDP emanating from business and financial services, with these sectors keeping nearly 10 percent of the population employed....
10 Pages (2500 words) Term Paper
sponsored ads
We use cookies to create the best experience for you. Keep on browsing if you are OK with that, or find out how to manage cookies.
Contact Us